How Do I Know Which Pages Lead to the Most Conversions?
Most website owners have no idea which pages actually make them money.
They know traffic numbers. They see visitor counts. But when it comes to understanding which pages lead to the most conversions, they're flying blind.
This isn't a small problem. It's the difference between investing time and money on pages that work versus pages that just exist. The gap between knowing and guessing can make or break your business growth in 2026.
Key Takeaways
- Conversion tracking reveals your money pages – Analytics tools show exactly which pages turn visitors into customers, not just which pages get traffic
- Page type matters more than you think – Landing pages convert at 11.9% on average while standard pages struggle to reach 2.9%[1]
- Traffic source changes everything – The same page converts differently depending on whether visitors arrive from search, email, or social media[1]
- Form friction kills conversions – Click-based pages convert at 11.3% versus just 4.1% for form-based pages[1]
- Your analytics dashboard holds the answers – The data already exists; you just need to know where to look
Understanding Which Pages Lead to the Most Conversions
Conversion tracking isn't complicated once you strip away the jargon.
A conversion is any action that matters to your business. A purchase. A signup. A phone call. A download.
The pages that lead to these actions are your money pages.
But here's what most people miss: high-traffic pages aren't always high-conversion pages.
You might have a blog post that gets thousands of visitors but generates zero sales. Meanwhile, a buried product page with 50 monthly visitors might generate five paying customers.
Traffic doesn't equal value. Conversions do.
The Reality of Conversion Rates
The average conversion rate across all industries sits between 2.35% and 2.9%[1][3].
That means out of every 100 visitors, only 2-3 take action.
But averages hide the real story. The top 10% of websites achieve conversion rates exceeding 11.45%, while 40% of marketers struggle below 0.5%[3].
The difference? They know which pages work and double down on them.
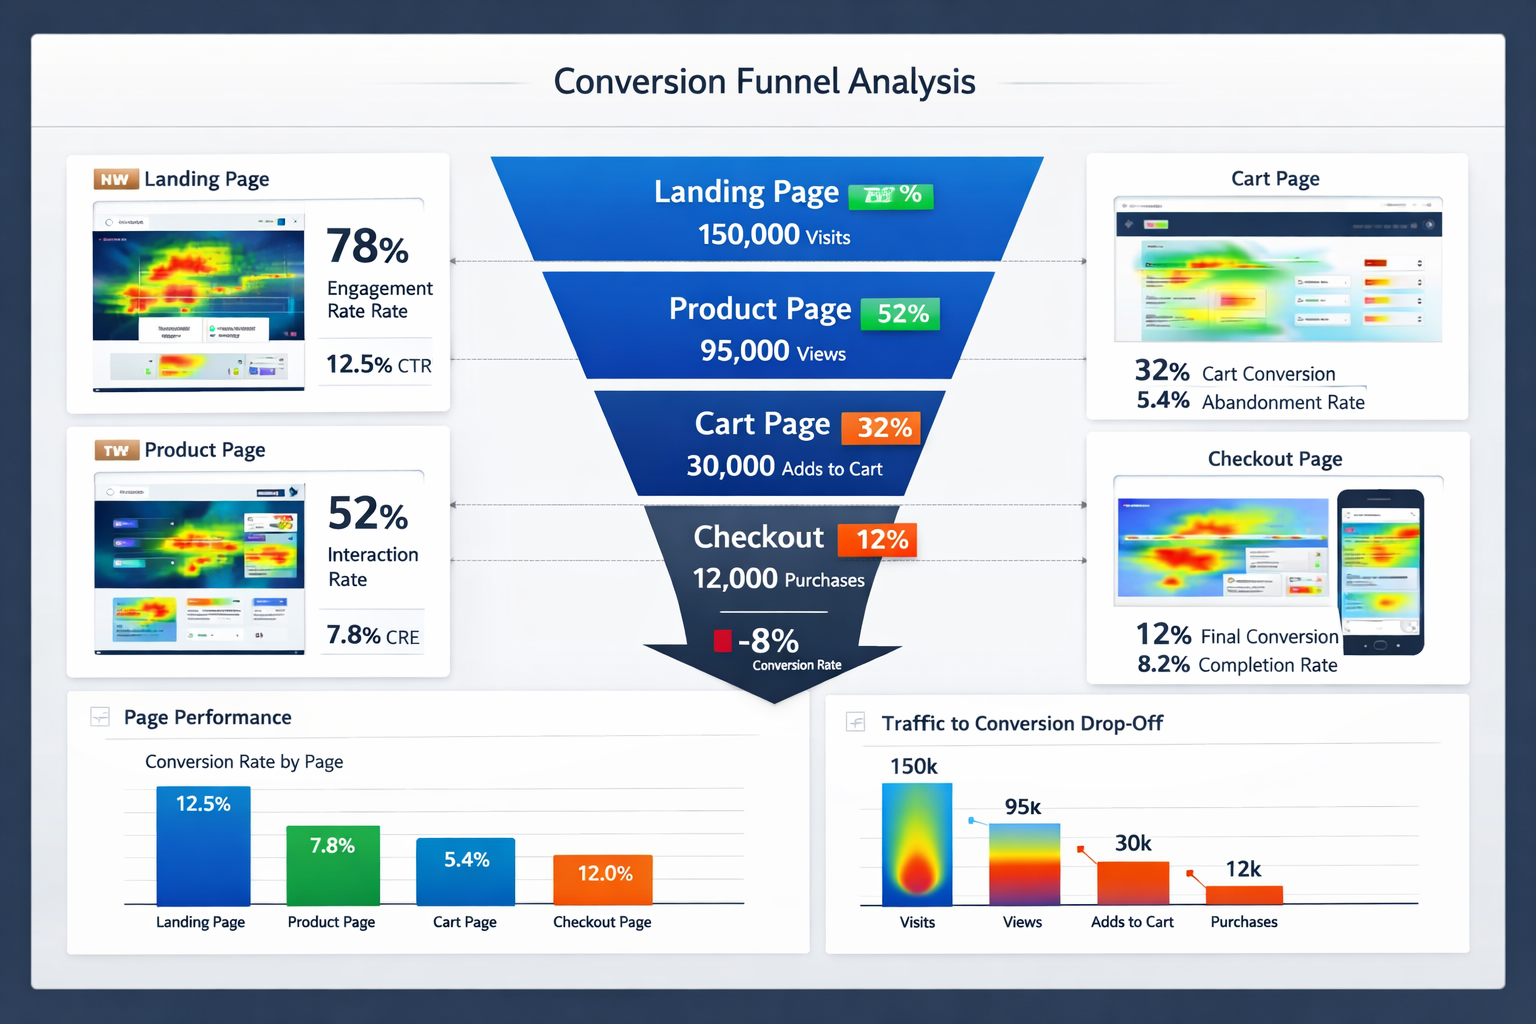
How to Identify Your Highest Converting Pages
Start with your analytics platform.
Google Analytics, Adobe Analytics, or any modern tracking tool will show you conversion data by page. You don't need expensive software. You need to look at the right reports.
Set Up Proper Conversion Tracking
Before you can identify which pages lead to the most conversions, you need to define what conversions matter.
Create goals for each important action:
- Form submissions
- Product purchases
- Email signups
- Phone calls
- Downloads
- Account creation
Each goal needs its own tracking code. This tells your analytics platform when someone completes an action and which page they were on.
Once tracking is active, your dashboard becomes a goldmine of conversion intelligence.
The Pages That Convert Best
Not all pages are created equal.
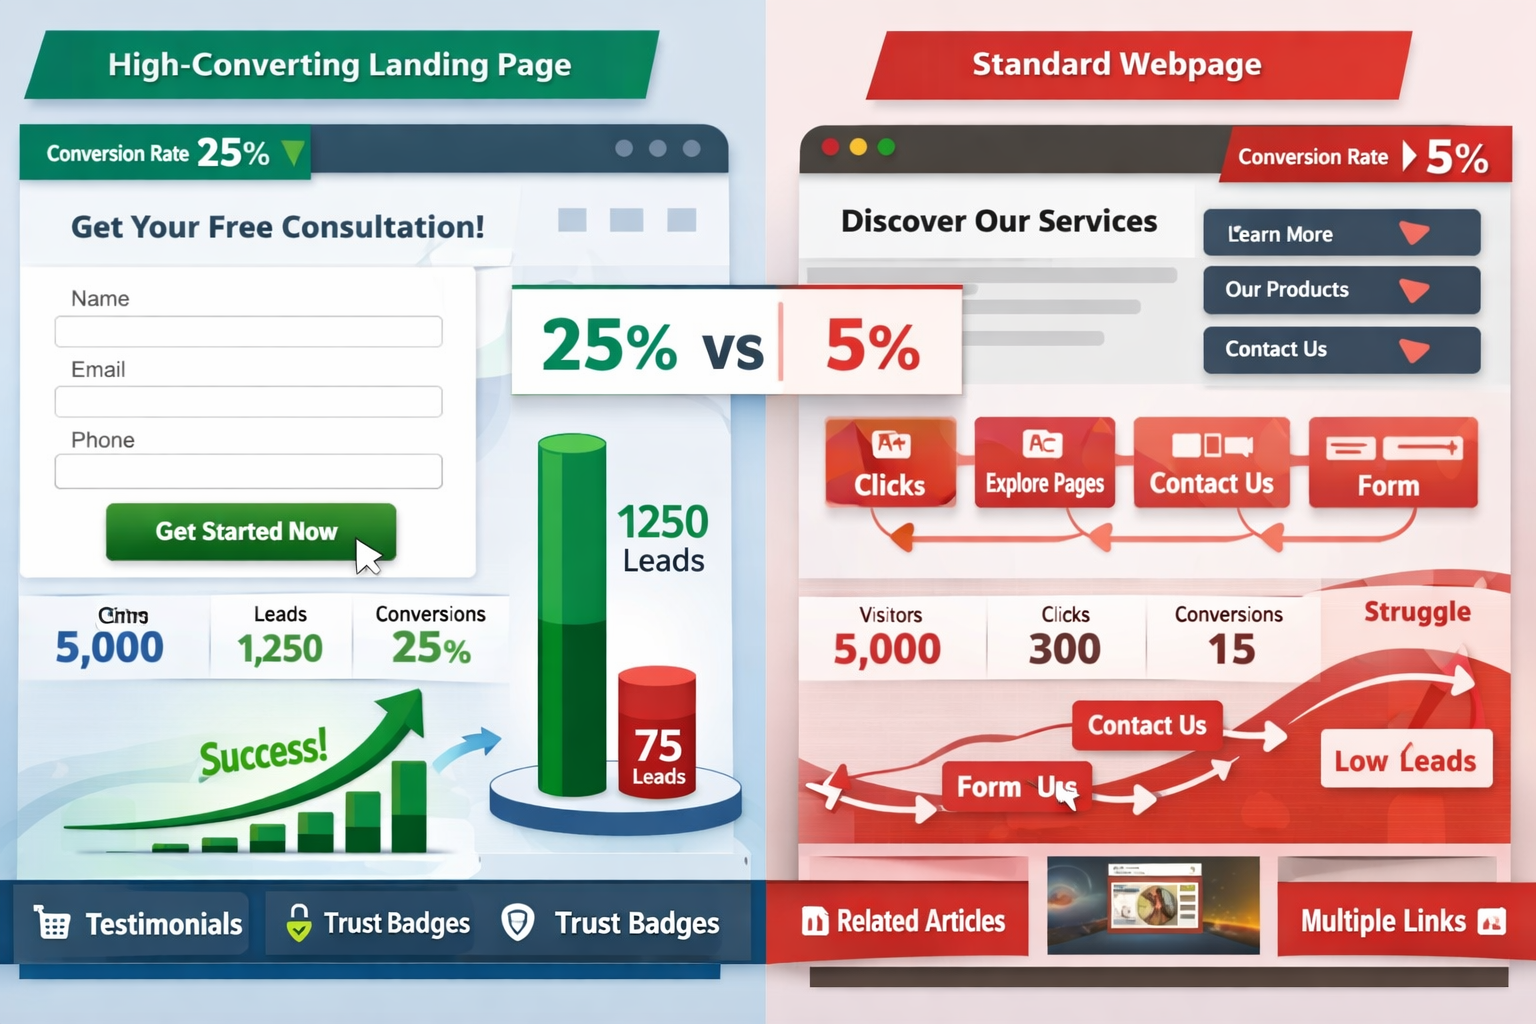
Lead generation landing pages substantially outperform standard pages at 11.9% average conversion rate[1]. That's four times higher than typical website pages.
Why? Because landing pages have one job. No navigation distractions. No competing calls to action. Just a clear path from visitor to conversion.
Here's what the data shows about different page types:
| Page Type | Average Conversion Rate |
|---|---|
| Lead Generation Landing Pages | 11.9% |
| Click-Based Landing Pages | 11.3% |
| Education Industry Pages | 14.2% |
| Ecommerce Landing Pages | 12.9% |
| SaaS Landing Pages | 9.5% |
| Form-Based Landing Pages | 4.1% |
| Standard Website Pages | 2.35-2.9% |
The pattern is clear. Specialized pages with focused purposes convert better than general pages[1].
Click vs. Form: The Friction Factor
Here's something most people get wrong.
Click-based landing page campaigns convert significantly better than form-based campaigns – 11.3% versus 4.1%[1].
Users don't want to fill out forms. They want to click a button and move forward.
Every form field is a barrier. Every required field is a reason to leave.
The pages that convert best understand this. They reduce friction. They make the next step obvious and easy.
Traffic Sources That Drive Conversions
The same page converts differently depending on where visitors come from.
Direct traffic converts best across all sources at 3.3% average conversion rate[1]. These are people who typed your URL directly or clicked a bookmark. They already know you. They're warmer.
For ecommerce specifically, search traffic leads at 3% average conversion rate, followed by direct traffic at 2.6%[1]. Email and social media each achieve only 1-2%.
This matters because it tells you which pages to optimize for which traffic sources.
If your product page gets most of its traffic from search, optimize for search intent. If your landing page gets traffic from email campaigns, match the messaging to your email copy.
Industry Differences in Page Performance
Different industries see wildly different conversion rates.
The catering and restaurant industry leads with the highest conversion rate at 18.2% for landing pages[1]. People are hungry. They make quick decisions.
The legal industry hits 19% for click-based campaigns[1]. When you need a lawyer, you need one now.
The home improvement industry has the lowest conversion rate at 7.2% for landing pages[1]. These are bigger decisions with longer consideration periods.
Your industry matters. Compare your pages to industry benchmarks, not to completely different businesses.
Content Length and Conversion Performance
Here's a counterintuitive finding.
Long-form landing pages generate 220% more leads than short-form versions[3].
Most people assume shorter is better. Get to the point. Don't waste time.
But conversion isn't about speed. It's about confidence.
Longer pages give visitors more information. More proof. More reasons to trust you. More answers to unspoken objections.
The pages that convert best don't rush. They build the case.
This doesn't mean every page should be 5,000 words. It means the pages asking for high-commitment actions (purchases, consultations, signups) need enough content to overcome hesitation.
The Power of User-Generated Content
This one surprised even experienced marketers.
User-generated content dramatically increases conversions, with a 102% lift when users actively engage with UGC[2][3].
SaaS pages specifically see a 154% conversion increase with UGC implementation[2][3].
Why does this work?
Because people trust other people more than they trust marketing copy.
User-generated images on product pages increase conversions by 106.3%[1]. When someone sees a real customer photo instead of a stock image, belief increases.
Image gallery interactions boost conversions by 110.7%[1]. Engagement with real customer content creates confidence.
The pages that convert best show real people using real products. They include reviews, testimonials, photos, and videos from actual customers.
Finding Your Money Pages: A Practical Process
Stop guessing. Start measuring.
Here's how to identify which pages lead to the most conversions on your website:
Step 1: Review your conversion goals
Make sure every important action is tracked. If it matters to your business, it needs a goal in your analytics.
Step 2: Pull a conversion report by page
Most analytics platforms have a "Goals by Page" or "Conversions by URL" report. This shows exactly which pages generated conversions.
Step 3: Look at conversion rate, not just volume
A page with 10 conversions from 50 visitors (20% conversion rate) is more valuable than a page with 20 conversions from 1,000 visitors (2% conversion rate).
Step 4: Segment by traffic source
Check how each page performs with different traffic sources. A page might convert poorly with social traffic but excellently with email traffic.
Step 5: Identify patterns
What do your highest-converting pages have in common? Length? Layout? Content type? Call to action?
Step 6: Double down on what works
Once you know which pages lead to the most conversions, send more traffic there. Improve them further. Create similar pages.
Common Mistakes When Analyzing Conversion Pages
Most people make the same errors.
Mistake 1: Focusing only on traffic
High traffic doesn't mean high conversions. Your most-visited page might be your worst converter.
Mistake 2: Ignoring micro-conversions
Not every conversion is a sale. Email signups, video views, and downloads all indicate engagement and can predict future purchases.
Mistake 3: Looking at too short a timeframe
One week of data proves nothing. Look at 30, 60, or 90 days minimum to identify real patterns.
Mistake 4: Not testing changes
Once you identify high-converting pages, test variations. Small improvements to your best pages generate outsized returns.
Mistake 5: Forgetting mobile
Check conversion rates separately for desktop and mobile. The same page often performs very differently on different devices.
Optimizing Your Highest Converting Pages
Once you know which pages lead to the most conversions, make them better.
Small improvements to high-performing pages matter more than big changes to low-traffic pages.
Test These Elements First
- Headline clarity – Does it immediately communicate value?
- Call to action visibility – Can visitors see what to do next?
- Form length – Can you remove fields without losing necessary information?
- Trust signals – Do you show reviews, testimonials, security badges, or guarantees?
- Page speed – Does it load in under 3 seconds?
- Mobile experience – Is it genuinely easy to convert on a phone?
Each small improvement compounds.
A 10% improvement to a page that generates 100 conversions per month means 10 additional conversions. Every month. Forever.
Taking Action on Conversion Data
Data without action is just numbers.
Now that you understand which pages lead to the most conversions, here's what to do:
Prioritize your best pages
Give your highest-converting pages the attention they deserve. Update them regularly. Keep them fast. Make them better.
Fix underperforming pages
If a page gets traffic but doesn't convert, either improve it or redirect that traffic to pages that do convert.
Create more of what works
If your case study pages convert well, create more case studies. If your comparison pages work, build more comparisons.
Match traffic to page intent
Send email traffic to pages optimized for email visitors. Send search traffic to pages optimized for search intent.
Monitor changes over time
Conversion rates shift. What worked last quarter might not work this quarter. Check your dashboard regularly.
Conclusion
Understanding which pages lead to the most conversions isn't optional anymore.
It's the difference between growing your business and wondering why nothing works.
The data already exists in your analytics. You just need to look at it the right way.
Start simple. Identify your top five converting pages. Understand why they work. Send more traffic there. Make them better.
Then tackle the pages that should convert but don't.
This isn't complicated. It's just focused attention on what actually matters.
Your next steps:
- Log into your analytics and identify your top 5 converting pages
- Check the conversion rate by traffic source for each page
- Look for common elements among your best performers
- Test one improvement on your highest-converting page this week
- Set a reminder to review conversion data monthly
The websites that win in 2026 won't be the ones with the most traffic. They'll be the ones that know exactly which pages turn visitors into customers – and do more of what works.
Ready to take control of your conversion data? Get started with proper tracking and turn your analytics into actionable intelligence.
SEO Meta Title and Description
Meta Title: Which Pages Lead to Most Conversions? Find Your Money Pages
Meta Description: Learn how to identify which pages lead to the most conversions on your website. Data-driven strategies to find and optimize your highest-performing pages.
References
[1] Conversion Rate Optimization Statistics - https://bloggingwizard.com/conversion-rate-optimization-statistics/
[2] Conversion Rate Optimization Statistics - https://www.wordstream.com/blog/conversion-rate-optimization-statistics
[3] Conversion Rate Optimization Statistics - https://thefrankagency.com/blog/conversion-rate-optimization-statistics/
Other frequently asked questions
- How Do I Check Which Pages People Spend the Most Time On
- How Do I Track Sales From My Google Ads Campaigns
- Will AI Take Over Data Analytics
- How Do I Track Phone Calls or Email Clicks as Conversions
- How Do I Track How Many People Fill Out My Contact Form
- How Do I Track How Many People Watch a Video or Download a Brochure
- How Do I Know Which Pages Lead to the Most Conversions
- How Do I See Where Most People Drop Off During Checkout
- How Do I See Where My Website Visitors Are Coming From
- How Do I See Which Blog Posts Bring Me the Most Visitors
- How Do I Check if My Homepage Is Actually Performing Well
- How Do I Find Out How Long It Takes Someone to Become a Customer
- How Do I Find Out What Paths People Take Before They Buy or Sign Up
- How Do I Measure Which Traffic Source Brings the Most Paying Customers
- How Do I See if Discounts or Offers Increase Sales
- How to See What Visitors Do First When They Land on Your Site