How Do I Know Which Content Keeps Visitors Engaged the Longest?

Your website gets traffic. That's good.
But here's the question that matters: are people actually reading what you publish, or are they bouncing after three seconds?
If you're running a business, you don't have time to guess. You need to know which content keeps visitors engaged the longest so you can create more of what works and stop wasting time on what doesn't.
The answer isn't complicated, but it does require looking at the right metrics in the right way.
Key Takeaways
- Time on page and scroll depth are the two most reliable indicators of content engagement
- Bounce rate alone doesn't tell the full story—you need context from other metrics
- Google Analytics 4 provides engagement metrics that show which pages hold attention
- Heatmaps and session recordings reveal how visitors actually interact with your content
- Testing different content types helps you identify what resonates with your specific audience
Understanding Engagement Metrics That Actually Matter
Most website owners look at the wrong numbers.
They obsess over page views. They celebrate traffic spikes. But traffic without engagement is just noise.
Engagement means someone stayed. They read. They scrolled. They cared enough to keep going.
Here's what to watch instead.
Time on Page vs. Session Duration
Time on page tells you how long someone spent on a specific piece of content.
Session duration tells you how long they stayed on your entire site.
Both matter, but for different reasons.
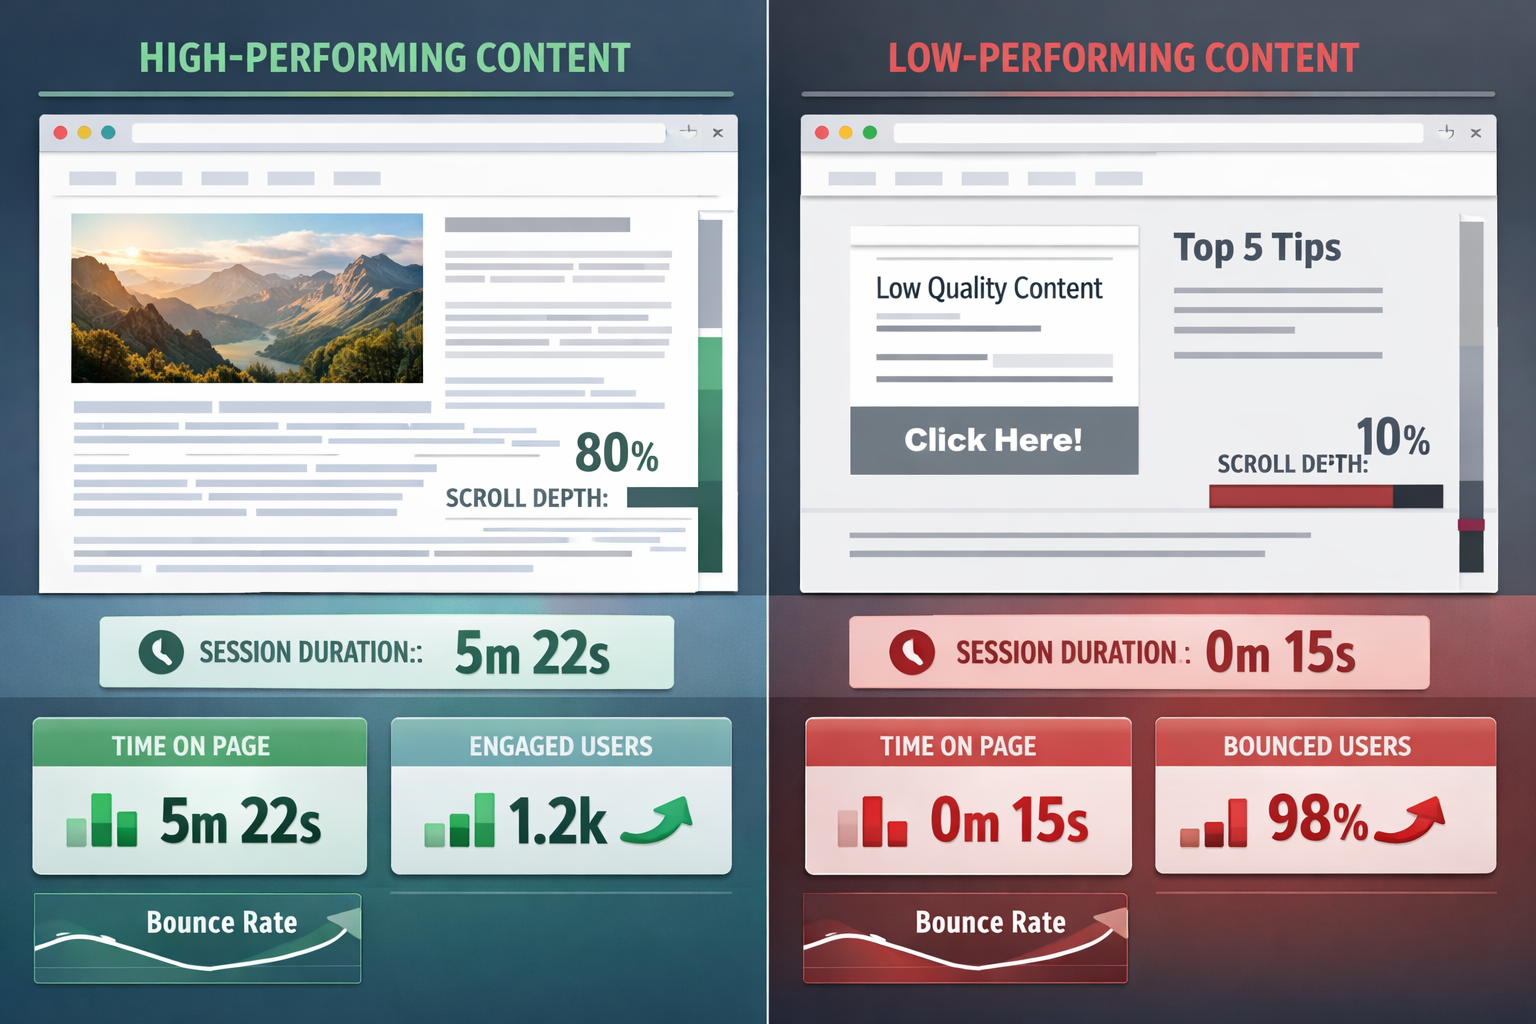
If someone spends four minutes on a blog post, that's engagement. If they spend 12 seconds, they probably didn't find what they needed.
The trick is knowing what "good" looks like for your content. A quick FAQ answer might only need 30 seconds. A detailed guide should hold attention for several minutes.
Scroll Depth: The Metric Most People Ignore
Someone can land on your page and leave it open while they make coffee.
That shows up as "time on page," but it's not real engagement.
Scroll depth fixes this problem.
It measures how far down the page someone scrolls. If 80% of visitors scroll to the bottom of an article, that content is working. If most people never make it past the first paragraph, something's broken.
This metric doesn't lie.
Bounce Rate in Context
Bounce rate means someone visited one page and left without clicking anything else.
Here's the thing: a high bounce rate isn't always bad.
If someone lands on your contact page, finds your phone number, and calls you—that's a bounce. But it's also a conversion.
Context matters. Look at bounce rate alongside time on page and scroll depth. That combination tells the real story.
How Do I Know Which Content Keeps Visitors Engaged the Longest Using Analytics Tools?
You need the right tools to measure engagement properly.
Google Analytics 4 changed how engagement is tracked in 2026. It's better than the old version, but you need to know where to look.
Setting Up Google Analytics 4 for Engagement Tracking
GA4 automatically tracks engaged sessions.
An engaged session is one where someone either:
- Stays for 10+ seconds
- Views two or more pages
- Triggers a conversion event
Go to Reports > Engagement > Pages and screens in your dashboard.
Sort by "Average engagement time" to see which content holds attention longest.
This view shows you exactly which pages keep people reading. The numbers don't lie.
Using Google Search Console Data
Search Console shows you which pages get clicks from Google.
But here's what most people miss: you can cross-reference this with your engagement data.
If a page gets lots of clicks but terrible engagement metrics, the content doesn't match what people expected from the search result.
That's a content problem, not a traffic problem.
Heatmap Tools That Show Real Behavior
Numbers tell you what happened. Heatmaps show you how it happened.
Tools like Hotjar or Microsoft Clarity record where people click, how far they scroll, and where they lose interest.
You'll see patterns you'd never spot in spreadsheets.
Maybe everyone stops reading at the same paragraph. Maybe they're clicking on something that isn't a link. Maybe they're completely ignoring your main call-to-action.
This is gold for understanding engagement.
Identifying Your Best-Performing Content
Once you're tracking the right metrics, patterns emerge quickly.
Some content just works better.
The 80/20 Rule for Content Engagement
In most cases, about 20% of your content drives 80% of your meaningful engagement.
Find those pages.
Look for content with:
- Above-average time on page (compare to your site average)
- High scroll depth (70%+ of visitors reaching the bottom)
- Low exit rates (people continue browsing after reading)
- Return visitors (people come back to reference it again)
These are your winners.
Comparing Content Types
Not all content serves the same purpose.
Blog posts should engage differently than product pages. Guides should perform differently than news updates.
Create segments in your analytics:
- How-to guides
- Product descriptions
- Case studies
- News and updates
- Resource pages
Compare engagement within each category. This shows you which content type resonates most with your audience.
Spotting Content That Underperforms
Low engagement content usually falls into predictable patterns.
Short time on page + high bounce rate = The content doesn't match the headline or search intent.
Good time on page + low scroll depth = People start reading but lose interest quickly. The opening is strong but the rest falls flat.
High traffic + low engagement = You're ranking for the wrong keywords or your content is outdated.
Fix these issues and watch engagement climb.
What Makes Content Engaging in Practice
Knowing which content works is step one.
Understanding why it works is step two.
Content Structure That Keeps People Reading
The brain processes information in chunks.
Long paragraphs feel like work. Short ones feel like conversation.
Look at your best-performing content. Chances are it uses:
- Short paragraphs (2-4 lines maximum)
- Frequent subheadings that break up sections
- Bullet points and numbered lists
- Bold text to highlight key concepts
- White space that gives eyes a rest
These aren't tricks. They're how people actually read online.
The Hook That Matters Most
The first 100 words determine everything.
If someone doesn't connect with your opening, they won't scroll. They won't read. They won't engage.
Your best content probably starts with:
- A specific problem the reader recognizes
- A surprising statement that challenges assumptions
- A clear promise of what they'll learn
- A relatable scenario that draws them in
Generic introductions kill engagement before it starts.
Depth vs. Brevity: Finding the Balance
Some topics need 2,000 words. Others need 300.
The question isn't "how long should content be?" It's "how long does this topic need to be properly covered?"
Check your analytics. If people consistently scroll to the bottom of longer content, your audience wants depth. If they bail halfway through short articles, you're not providing enough value.
Let the data guide your content length decisions.
Taking Action: Improving Content Engagement
Understanding metrics is pointless without action.
Here's how to use what you've learned.
Start With Your Top 10 Pages
Don't try to fix everything at once.
Identify your 10 most-visited pages. Check their engagement metrics.
For pages with good traffic but poor engagement:
- Rewrite the opening paragraph
- Add subheadings every 150-200 words
- Break up long paragraphs
- Add relevant examples or data
- Update outdated information
Make one change at a time. Measure the impact. Repeat.
Create More of What Works
This sounds obvious, but most people don't do it.
If your case studies get 4-minute average engagement while your news posts get 45 seconds, the message is clear.
Double down on case studies.
If how-to guides outperform everything else, create more how-to guides.
Your audience is telling you what they want. Listen.
Test and Refine Continuously
Engagement isn't static.
What worked last year might not work in 2026. Audience preferences shift. Search behavior changes. Competitors improve.
Set a monthly reminder to review your engagement metrics. Look for:
- Content that's declining in performance
- New pages that are exceeding expectations
- Patterns across your best performers
- Opportunities to update or expand popular content
This becomes easier over time. The patterns become obvious.
Conclusion: Turning Data Into Better Content
How do I know which content keeps visitors engaged the longest? You measure the right metrics, analyze the patterns, and act on what the data shows you.
Time on page, scroll depth, and engaged sessions tell you what's working. Heatmaps show you why. Comparing content types reveals what your audience actually wants.
But here's the truth: most website owners never look at these numbers. They publish content and hope for the best.
You don't have to guess anymore.
Start with your analytics. Identify your top performers. Understand what makes them work. Create more content like that.
The data is already there, waiting to show you exactly which content deserves more of your time and which deserves none.
Next steps:
- Log into your analytics dashboard and sort pages by engagement time
- Identify your top 5 most engaging pieces of content
- Note what they have in common (structure, length, topic, format)
- Create your next piece of content using those same principles
- Measure the results and refine your approach
Want to track engagement without the complexity? Get started with tools that make sense for business owners who need clarity, not confusion.
If you need help understanding your analytics or want guidance on improving engagement, reach out. Sometimes a second set of eyes spots patterns you've been missing.
Other frequently asked questions
- How Do I Check Which Pages People Spend the Most Time On
- How Do I Track Sales From My Google Ads Campaigns
- Will AI Take Over Data Analytics
- How Do I Track Phone Calls or Email Clicks as Conversions
- How Do I Track How Many People Fill Out My Contact Form
- How Do I Track How Many People Watch a Video or Download a Brochure
- How Do I Know Which Pages Lead to the Most Conversions
- How Do I See Where Most People Drop Off During Checkout
- How Do I See Where My Website Visitors Are Coming From
- How Do I See Which Blog Posts Bring Me the Most Visitors
- How Do I Check if My Homepage Is Actually Performing Well
- How Do I Find Out How Long It Takes Someone to Become a Customer
- How Do I Find Out What Paths People Take Before They Buy or Sign Up
- How Do I Measure Which Traffic Source Brings the Most Paying Customers
- How Do I See if Discounts or Offers Increase Sales
- How to See What Visitors Do First When They Land on Your Site