How Do I Find Out Where People Click the Most on My Website?

Your website gets traffic. But what are visitors actually doing once they land on your pages?
Understanding where people click the most on your website isn't just interesting data. It's the difference between guessing what works and knowing what works. When you see exactly where visitors click, tap, and scroll, you can fix what's broken and double down on what's driving results.
The good news? Finding out where people click the most on your website is simpler than most business owners think. You don't need a marketing degree or a massive budget. You just need the right tools and a clear plan.
Key Takeaways
- Heatmaps show visual click patterns with color-coded overlays that reveal exactly where visitors engage most
- Session recordings let you watch real user behavior to understand the "why" behind click patterns
- Analytics event tracking provides quantifiable data on specific button and link clicks
- Free tools exist that deliver professional-grade insights without requiring technical expertise
- Action matters more than data – use click insights to make immediate improvements to your website
Why Knowing Click Patterns Changes Everything
Most website owners make decisions based on assumptions.
They assume visitors see their call-to-action button. They assume people read the entire homepage. They assume the navigation menu makes sense.
But assumptions cost money.
When you know where people actually click, you stop wasting time on elements nobody uses. You stop wondering why your contact form gets ignored. You start making changes based on real behavior, not guesswork.
Think of it this way: your visitors are telling you exactly what they want. They're voting with their clicks. You just need to listen.
How Do I Find Out Where People Click the Most on My Website? The Three Main Methods
There are three proven ways to track click behavior. Each gives you different insights.
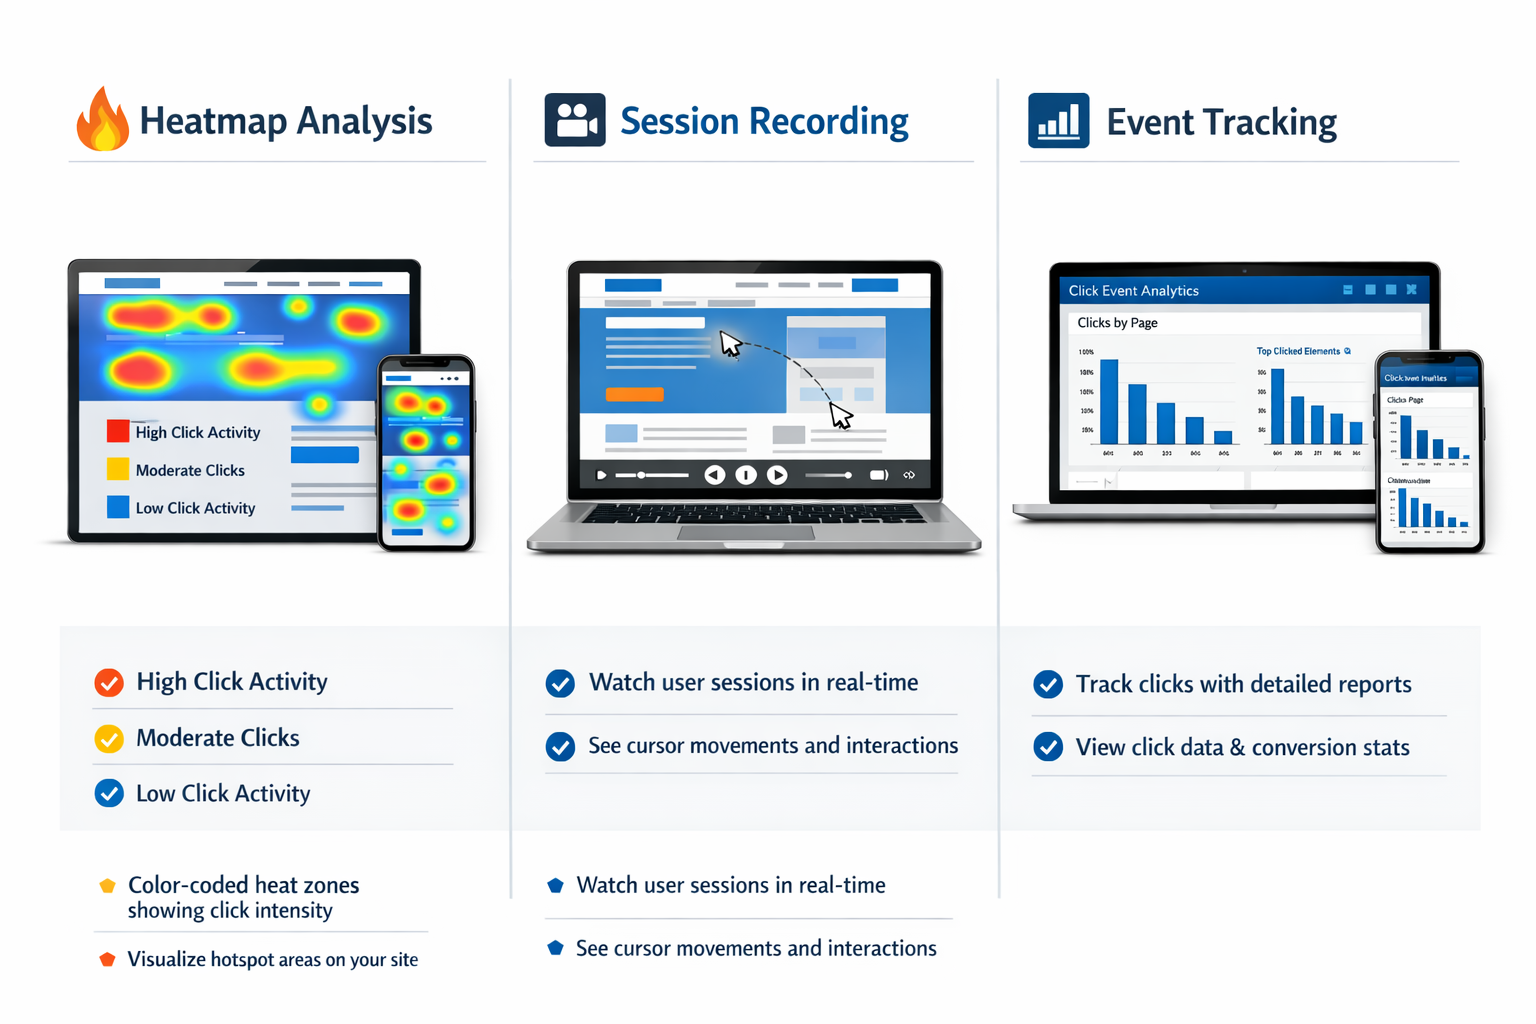
Heatmaps: The Visual Approach
Heatmaps show you click data as a color overlay on your actual website pages.
Red zones mean lots of clicks. Orange means moderate activity. Blue means barely any interaction. It's visual, immediate, and easy to understand.
You'll see things you never expected. People clicking on images that aren't links. Visitors ignoring your main call-to-action. Important buttons getting zero attention because they're in the wrong spot.
Popular heatmap tools include Hotjar, Microsoft Clarity, and Crazy Egg. Many offer free plans that work perfectly for small to medium businesses.
The beauty of heatmaps? You don't need to interpret complex data tables. One glance tells you the story.
Session Recordings: Watch Real Behavior
Session recordings are like security camera footage for your website.
You watch actual visitors navigate your pages. You see where they click, where they hesitate, where they get confused and leave.
This method reveals the "why" behind the clicks. Maybe people aren't clicking your signup button because they're distracted by something else. Maybe they're clicking the wrong element because your design is confusing.
Session recordings take more time to review than heatmaps. But they give you context that raw data can't provide.
Most heatmap tools include session recording features. Microsoft Clarity offers this completely free in 2026, making it an excellent starting point.
Analytics Event Tracking: The Numbers Approach
Google Analytics and similar platforms let you track specific click events.
You tag buttons, links, and other clickable elements. Then you see exactly how many people clicked each one.
This method gives you precise numbers. You'll know that 247 people clicked your "Get Started" button last week, while only 12 clicked the "Learn More" link.
Event tracking requires a bit more setup than heatmaps. You need to configure tracking codes or use a tag manager. But once it's running, you get reliable, quantifiable data.
For business owners who want hard numbers to guide decisions, this approach delivers.
How to Actually Set This Up (Without Losing Your Mind)
Here's the practical path forward.
Start with a free heatmap tool. Sign up for Microsoft Clarity or Hotjar's free plan. Install the tracking code on your website. Most platforms have simple WordPress plugins or one-click integrations.
Let it collect data for at least a week. You need enough visitors to see meaningful patterns. If your site gets 100 visitors per day, wait seven days. If you get 1,000 per day, three days might be enough.
Review your most important pages first. Don't try to analyze everything at once. Start with your homepage, main product page, or whatever page drives your business.
Look for surprises. The value isn't in confirming what you already know. It's in discovering what you didn't expect.
Are people clicking non-clickable elements? That's a design problem. Is your main call-to-action getting ignored? That's a positioning or messaging problem. Are visitors clicking "back" immediately? That's a content or targeting problem.
What to Do With Click Data Once You Have It
Data without action is just trivia.
Here's how to turn insights into improvements:
Fix broken expectations. If visitors keep clicking something that isn't a link, make it a link or change the design so it doesn't look clickable.
Move important elements to hot zones. If people click the top-left corner constantly but your signup button is bottom-right, you know what to do.
Remove distractions. If something gets tons of clicks but doesn't serve your business goals, consider removing it. Every click is attention. Make sure attention goes where it matters.
Test your changes. Make one improvement at a time. Check if click patterns improve. This is how you learn what actually works for your specific audience.
The dashboard approach many tools offer makes this process straightforward. You see the data, make the change, see the new data.
Common Mistakes to Avoid
Mistake one: Analyzing too soon. Wait for enough data. Fifty visitors isn't enough to draw conclusions. Five hundred gives you a better picture.
Mistake two: Ignoring mobile. More than half of web traffic comes from phones in 2026. Check click patterns separately for mobile and desktop. Behavior differs dramatically.
Mistake three: Collecting data forever without acting. Set a review schedule. Every two weeks, look at your click data and make one improvement. Small, consistent changes beat perfect analysis.
Mistake four: Trusting only one method. Heatmaps show where. Session recordings show why. Analytics show how many. Use at least two methods for a complete picture.
How Do I Find Out Where People Click the Most on My Website? Quick Start Guide
If you want results today, follow this plan:
- Choose one free tool (Microsoft Clarity is the easiest start in 2026)
- Install it on your website (most take under 10 minutes)
- Wait one week for data collection
- Review your homepage heatmap
- Identify one obvious problem
- Fix that problem
- Repeat weekly
That's it. No complexity required.
The businesses that win aren't the ones with the most sophisticated analytics. They're the ones that actually use simple insights to make real improvements.
Beyond Clicks: Understanding the Full Picture
Click tracking is powerful, but it's one piece of a larger puzzle.
Combine click data with conversion rates. A page might get lots of clicks but zero sales. That tells you engagement is high but messaging or offer needs work.
Combine click data with scroll depth. Maybe people aren't clicking your bottom call-to-action because they never scroll that far.
Combine click data with traffic sources. Visitors from Google might click differently than visitors from social media.
The goal isn't perfect data. The goal is better decisions. Click tracking gives you the foundation for those decisions.
When you're ready to explore more advanced tracking options, the partners and resources available through professional platforms can help you scale your insights.
Conclusion: Start Tracking, Start Improving
Finding out where people click the most on your website doesn't require expensive consultants or complex software.
It requires a simple tool, a week of patience, and the willingness to act on what you discover.
Your visitors are already telling you what works and what doesn't. Every click is a signal. Every ignored button is feedback. Every unexpected interaction is an opportunity.
The question isn't whether you should track clicks. The question is what you'll do differently once you know the truth about how people use your website.
Your next steps:
- Choose a tracking tool today (free options work great)
- Install it this week
- Review your first heatmap in seven days
- Make one improvement based on what you find
- Repeat the process every two weeks
That's how you move from guessing to knowing. That's how you build a website that actually works for your business.
Ready to see what your visitors are really doing? Get started with click tracking today and discover the insights hiding in plain sight.
Other frequently asked questions
- How Do I Check Which Pages People Spend the Most Time On
- How Do I Track Sales From My Google Ads Campaigns
- Will AI Take Over Data Analytics
- How Do I Track Phone Calls or Email Clicks as Conversions
- How Do I Track How Many People Fill Out My Contact Form
- How Do I Track How Many People Watch a Video or Download a Brochure
- How Do I Know Which Pages Lead to the Most Conversions
- How Do I See Where Most People Drop Off During Checkout
- How Do I See Where My Website Visitors Are Coming From
- How Do I See Which Blog Posts Bring Me the Most Visitors
- How Do I Check if My Homepage Is Actually Performing Well
- How Do I Find Out How Long It Takes Someone to Become a Customer
- How Do I Find Out What Paths People Take Before They Buy or Sign Up
- How Do I Measure Which Traffic Source Brings the Most Paying Customers
- How Do I See if Discounts or Offers Increase Sales
- How to See What Visitors Do First When They Land on Your Site