How Do I Compare Which Traffic Source Gives Me Better Leads - Google or Social?
You're spending money on marketing. Maybe a lot of it.
Some of it goes to Google. Some goes to social media. And somewhere in the middle, you're wondering which one is actually worth it.
Not which one gets more clicks. Which one brings in better leads—the kind that turn into paying customers.
That's the question that matters. And answering it properly means looking at the right numbers in the right way.
This guide walks through exactly how to compare which traffic source gives you better leads—Google or social—without getting lost in vanity metrics or complicated spreadsheets.
Key Takeaways
- Lead quality matters more than traffic volume - a smaller number of high-intent visitors often converts better than large volumes of casual browsers
- Track the full journey, not just the first click - many leads touch multiple channels before converting, so attribution matters
- Compare cost per qualified lead, not just cost per click - the cheapest traffic source rarely delivers the best business results
- Different sources serve different purposes - Google often captures existing demand while social builds awareness and nurtures relationships
- Test systematically over meaningful timeframes - at least 30-60 days of data gives you patterns worth trusting
Why Comparing Traffic Sources Actually Matters
Most business owners look at their analytics and see numbers.
Traffic from Google: 1,200 visits.
Traffic from social: 800 visits.
And they think Google is winning.
But those numbers don't tell you anything useful. What you need to know is which source brings people who actually want what you're selling.
A hundred visitors who are ready to buy beats a thousand who are just browsing.
The real question isn't about traffic volume. It's about lead quality.
When you understand which channel delivers better leads, you know where to put your time and money. You stop guessing and start growing.
Understanding the Fundamental Difference Between Google and Social Traffic
Before diving into how to compare which traffic source gives me better leads - Google or social, you need to understand what you're comparing.
Google Traffic: Intent-Driven
People on Google are searching for something specific.
They have a problem. They typed it into a search box. They're looking for an answer or a solution.
This means Google traffic typically arrives with high intent. They're further along in their decision-making process.
If someone searches "best CRM for small business," they're probably shopping right now.
Social Media Traffic: Discovery-Driven
Social media works differently.
People aren't there to find your business. They're there to scroll, connect, and be entertained.
Your content interrupts their feed. If it's good, they stop. If it's not, they keep scrolling.
This means social traffic typically arrives with lower immediate intent. They might be interested, but they're not necessarily ready to buy today.
Neither is better or worse. They're just different.
Understanding this difference helps you set realistic expectations for what each channel should deliver.
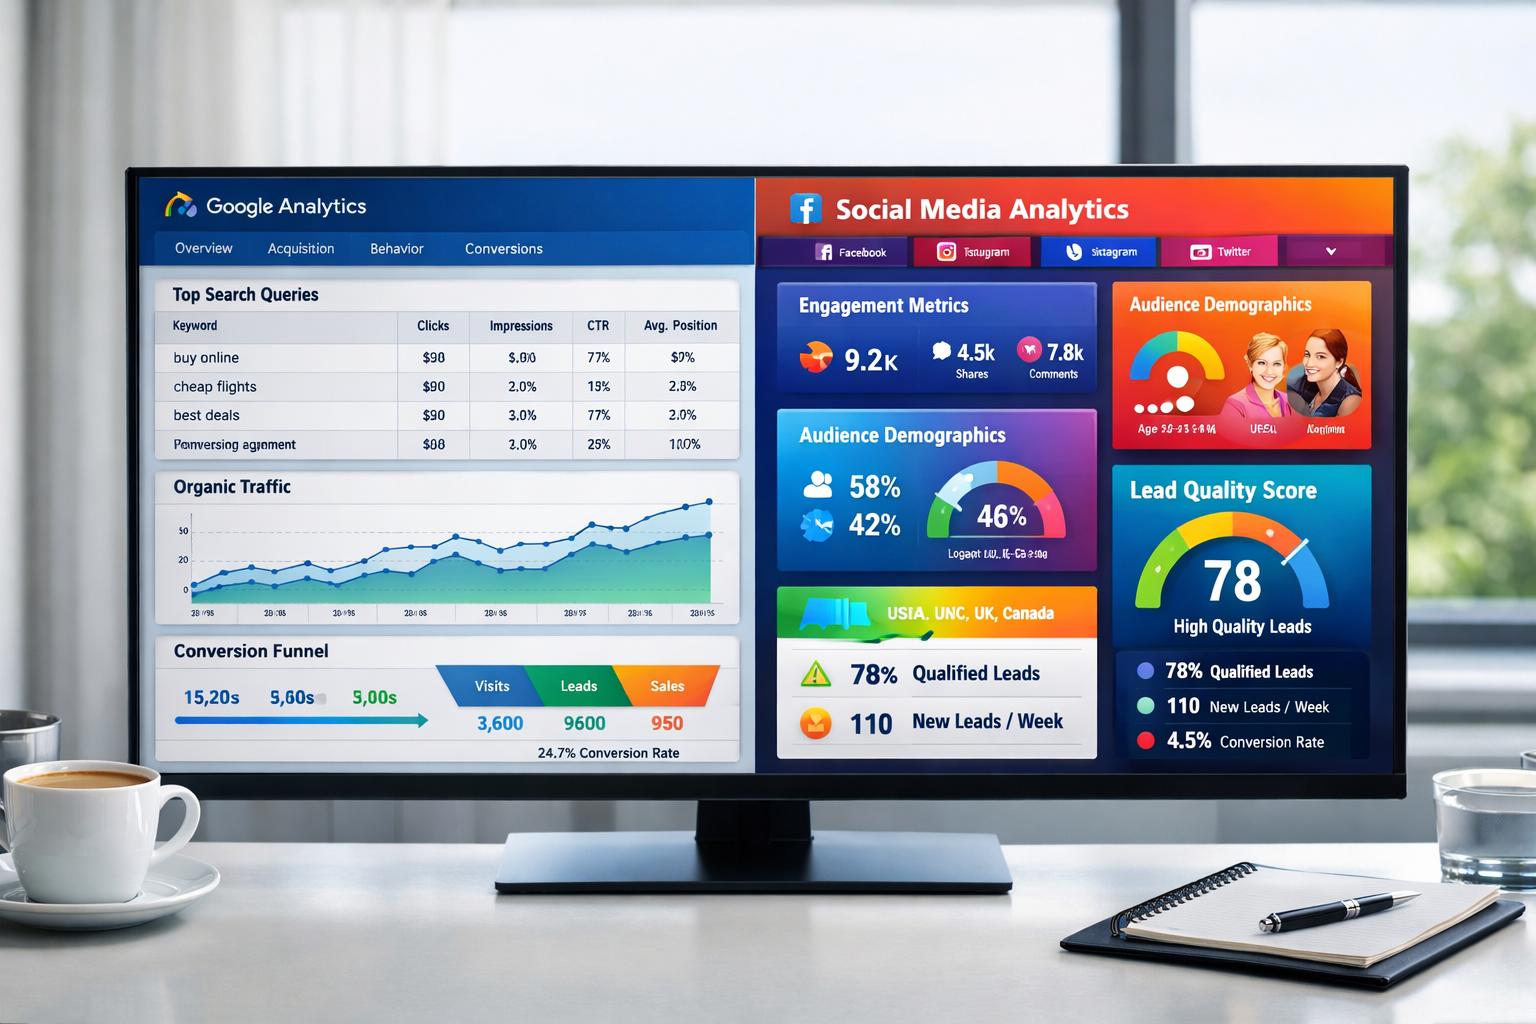
The Metrics That Actually Tell You About Lead Quality
Here's where most people go wrong.
They track clicks, impressions, and engagement rates. Those numbers feel good, but they don't pay the bills.
To compare which traffic source gives you better leads - Google or social - focus on these metrics instead:
Conversion Rate
What percentage of visitors from each source complete your desired action?
If 100 people come from Google and 5 fill out your contact form, that's a 5% conversion rate.
If 100 people come from Facebook and 1 fills out the form, that's 1%.
Higher conversion rate usually means better lead quality.
Cost Per Lead
How much are you spending to get one lead from each channel?
Take your total spend on Google ads and divide it by the number of leads you got.
Do the same for social.
The channel with the lower cost per lead is more efficient—but only if those leads are actually good.
Lead-to-Customer Rate
This is the big one.
What percentage of leads from each source actually become paying customers?
If Google sends you 20 leads and 4 become customers, that's a 20% lead-to-customer rate.
If social sends you 50 leads but only 2 become customers, that's 4%.
This metric tells you which channel delivers people who actually buy.
Customer Lifetime Value by Source
Not all customers are equal.
A customer who spends $500 once is different from one who spends $200 every month for two years.
Track which traffic source brings customers with higher lifetime value.
Sometimes the more expensive channel delivers customers who stick around longer and spend more.
Time to Conversion
How long does it take for a lead from each source to become a customer?
Google leads might convert in days. Social leads might take weeks or months.
This matters for cash flow and for understanding how each channel fits into your business model.
How to Set Up Proper Tracking to Compare Traffic Sources
You can't compare what you're not measuring.
Here's how to set up tracking that actually works:
Use UTM Parameters
Every link you share on social media should have UTM parameters.
These are little tags added to your URL that tell your analytics where the traffic came from.
Example: yoursite.com/landing-page?utm_source=facebook&utm_medium=social&utm_campaign=spring2026
This lets you see exactly which social posts or ads drove which leads.
Google organic traffic tracks automatically, but paid Google ads should also use UTM parameters for campaign-level tracking.
Set Up Goal Tracking
In your analytics platform, define what counts as a conversion.
Form submission. Phone call. Purchase. Demo request.
Whatever matters to your business, track it as a goal.
Then you can see which traffic sources complete those goals most often.
Implement CRM Source Tracking
When a lead enters your system, tag them with their traffic source.
This lets you track them all the way through your sales process.
You'll see which sources produce leads that close, not just leads that fill out forms.
Most modern CRMs can capture this automatically if you set them up correctly. If you need help organizing your data, explore the dashboard options available.
Track Multi-Touch Attribution
Here's the tricky part: most customers don't convert on their first visit.
They might find you on social media, leave, then come back through Google search later and buy.
Which source gets credit?
Both should.
Use multi-touch attribution to see the full customer journey. This shows you how different channels work together.
Step-by-Step: How to Compare Which Traffic Source Gives Me Better Leads - Google or Social
Now let's walk through the actual comparison process.
Step 1: Define Your Timeframe
You need enough data to see patterns.
At minimum, look at 30 days. Better yet, 60 or 90 days.
Seasonal businesses might need to compare the same period year-over-year.
Don't make decisions based on one week of data.
Step 2: Pull Traffic Data for Each Source
From your analytics, get these numbers for both Google and social:
- Total visits
- Unique visitors
- Bounce rate
- Average session duration
- Pages per session
This gives you baseline engagement data.
Step 3: Pull Conversion Data for Each Source
Now get these numbers:
- Total conversions (leads)
- Conversion rate
- Cost per conversion (if you're paying for traffic)
This shows you which source is more efficient at generating leads.
Step 4: Pull Sales Data for Each Source
From your CRM or sales system:
- Number of leads that became customers
- Lead-to-customer conversion rate
- Revenue generated from each source
- Average deal size from each source
- Customer lifetime value from each source
This is where you find out which source actually makes you money.
Step 5: Calculate Cost Per Customer
Take your total spend on each channel and divide by the number of customers (not leads) you got.
If you spent $1,000 on Google ads and got 5 customers, your cost per customer is $200.
If you spent $800 on social ads and got 2 customers, your cost per customer is $400.
This tells you which channel gives you better return on investment.
Step 6: Compare Lead Quality Indicators
Look beyond the numbers at qualitative factors:
- Do leads from one source ask better questions?
- Are they more prepared for sales conversations?
- Do they have realistic budgets?
- Are they decision-makers or just researchers?
Sometimes you can feel the quality difference before the data proves it.
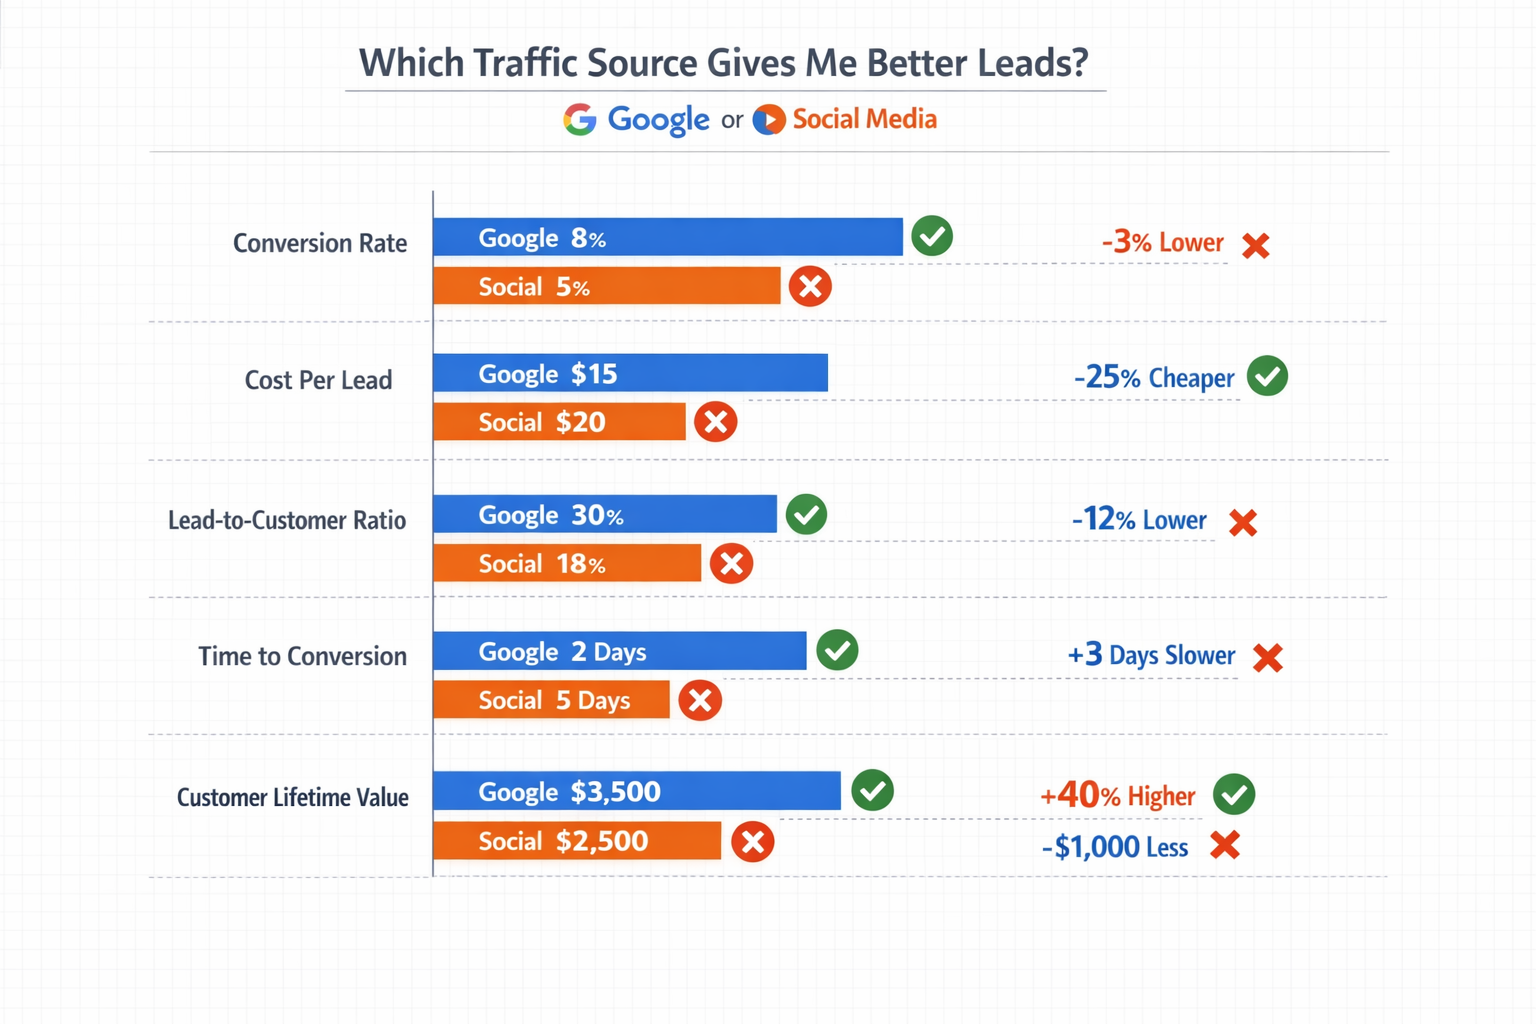
Common Patterns: What the Data Usually Shows
After helping hundreds of businesses compare traffic sources, certain patterns emerge.
Google Typically Wins on Immediate Intent
When someone searches for exactly what you offer, they're ready to engage.
Google traffic usually converts faster and at higher rates for bottom-of-funnel offers.
If you sell something people actively search for, Google often delivers better immediate leads.
Social Often Wins on Customer Lifetime Value
Social media lets you build relationships before asking for the sale.
The leads take longer to convert, but when they do, they often become more loyal customers.
They've seen your content. They trust you. They're not just comparing prices.
The Best Strategy Uses Both
Here's what many successful businesses discover: the question isn't which one is better.
It's how they work together.
Social media builds awareness and trust. Google captures people when they're ready to buy.
A lead might discover you on Instagram, follow you for months, then search for your business name on Google when they're ready to purchase.
Both channels contributed to that sale.
What to Do When the Data Surprises You
Sometimes the results aren't what you expected.
Maybe you've been pouring money into social media, but Google delivers ten times better leads.
Or maybe you assumed Google was your golden goose, but social media customers stick around three times longer.
When the data surprises you, don't ignore it.
If Google Outperforms Social
Consider shifting budget toward Google.
Invest in SEO to capture more organic traffic.
Expand your paid search campaigns.
Use social media for brand building, but focus your conversion efforts on search.
If Social Outperforms Google
Double down on the social platforms that work.
Create more content. Test more ad variations.
Build your organic following so you're not entirely dependent on paid reach.
Consider whether your business just isn't something people search for often—and that's okay.
If Neither Performs Well
The problem might not be the channel.
It might be your offer, your messaging, your landing pages, or your follow-up process.
Fix those first, then retest the channels.
Tools That Make Comparison Easier
You don't need expensive enterprise software to do this analysis.
Google Analytics
Free and powerful.
Shows you traffic sources, conversion rates, and user behavior.
Set up goals and you can track everything discussed in this guide.
Facebook/Instagram Insights
Built into your business accounts.
Shows you which posts drive traffic and engagement.
Connect it to your website analytics for the full picture.
CRM Systems
HubSpot, Salesforce, Pipedrive—whatever you use.
Tag leads by source and track them through your sales pipeline.
This connects marketing activity to actual revenue.
Spreadsheets
Sometimes the simplest tool is the best.
Pull data from your various platforms into one spreadsheet.
Calculate your key metrics manually.
This forces you to actually understand the numbers instead of just looking at dashboards.
If you're looking for a centralized way to manage your analytics, check out options at Opal44.
How Often Should You Compare Traffic Sources?
Don't obsess over daily fluctuations.
Review your traffic source performance monthly.
Look for trends over time, not day-to-day changes.
Quarterly, do a deeper analysis that includes customer lifetime value and long-term revenue attribution.
Annually, step back and look at the big picture. How has your channel mix evolved? What's working better or worse than last year?
This rhythm keeps you informed without creating analysis paralysis.
Making Decisions Based on Your Comparison
Data without action is just numbers on a screen.
Once you know which traffic source gives you better leads - Google or social - make actual changes.
Reallocate Budget
Move money from underperforming channels to ones that deliver better leads.
This doesn't mean abandoning a channel completely. It means being honest about what works.
Adjust Your Strategy
If Google works better, invest in SEO and search ads.
If social works better, create more content and build your community.
Match your effort to your results.
Test and Iterate
Just because social didn't work last quarter doesn't mean it won't work with different messaging or targeting.
Keep testing. Keep learning.
The best-performing channel today might not be the best one next year.
Document Your Findings
Write down what you learned.
Which campaigns worked? Which audiences responded? What messaging resonated?
This becomes your playbook for future marketing decisions.
For ongoing support and partnership opportunities, explore the partners page.
Avoiding Common Mistakes When Comparing Traffic Sources
Here are the traps that catch most people:
Mistake 1: Comparing Too Soon
One week of data tells you nothing.
Wait until you have meaningful sample sizes before drawing conclusions.
Mistake 2: Ignoring Attribution Complexity
Giving all credit to the last click oversimplifies the customer journey.
Someone might discover you on social, research you on Google, and convert through email.
All three channels contributed.
Mistake 3: Focusing Only on Cost
The cheapest lead isn't always the best lead.
A $10 lead that never buys is worse than a $50 lead that becomes a $5,000 customer.
Mistake 4: Not Tracking Long Enough
Some business models have long sales cycles.
If it takes 6 months for a lead to become a customer, you need to track for at least that long before judging a channel's effectiveness.
Mistake 5: Forgetting About Quality
A thousand low-quality leads create work without revenue.
Ten high-quality leads can transform your business.
Always prioritize quality over quantity.
What to Do Next
Now you know how to compare which traffic source gives me better leads - Google or social.
You understand the metrics that matter.
You know how to set up tracking.
You have a framework for analysis.
Here's what to do right now:
First, make sure your tracking is actually working. Check that your analytics captures traffic sources accurately. Set up or verify your conversion goals.
Second, pull the last 60 days of data and run through the comparison process outlined above. Calculate your key metrics for both Google and social traffic.
Third, identify one clear action based on what you find. Maybe it's shifting budget. Maybe it's improving your social content. Maybe it's investing more in SEO.
Fourth, set a reminder to review this again in 30 days. Track whether your changes improved results.
The businesses that grow aren't the ones with the best marketing channels. They're the ones that measure what works and do more of it.
Start measuring today. If you need help getting started, contact us for guidance.
Conclusion
Comparing traffic sources isn't about declaring a winner.
It's about understanding where your best customers come from so you can find more of them.
Google and social media serve different purposes. They attract different people at different stages of the buying journey.
The question isn't really "which one is better?" The question is "which one is better for my specific business right now?"
And the only way to answer that is with data.
Track the right metrics. Give it enough time. Make decisions based on what actually drives revenue, not what looks impressive in a dashboard.
Some businesses will find Google delivers better leads. Others will find social media builds more valuable customer relationships. Many will discover they need both, working together.
The answer is in your data. Go find it.
Ready to take control of your marketing analytics? Sign up to start tracking what really matters to your business.
Other frequently asked questions
- How Do I Check Which Pages People Spend the Most Time On
- How Do I Track Sales From My Google Ads Campaigns
- Will AI Take Over Data Analytics
- How Do I Track Phone Calls or Email Clicks as Conversions
- How Do I Track How Many People Fill Out My Contact Form
- How Do I Track How Many People Watch a Video or Download a Brochure
- How Do I Know Which Pages Lead to the Most Conversions
- How Do I See Where Most People Drop Off During Checkout
- How Do I See Where My Website Visitors Are Coming From
- How Do I See Which Blog Posts Bring Me the Most Visitors
- How Do I Check if My Homepage Is Actually Performing Well
- How Do I Find Out How Long It Takes Someone to Become a Customer
- How Do I Find Out What Paths People Take Before They Buy or Sign Up
- How Do I Measure Which Traffic Source Brings the Most Paying Customers
- How Do I See if Discounts or Offers Increase Sales
- How to See What Visitors Do First When They Land on Your Site