How Do I Check If People Scroll Down Far Enough to See My Offers?

You've spent hours crafting the perfect offer. You've positioned it on your website. But here's the uncomfortable question: is anyone actually seeing it?
Most business owners assume visitors scroll down their pages. They don't always. In fact, many people leave before they ever reach your carefully crafted offers sitting further down the page.
Understanding how to check if people scroll down far enough to see your offers isn't just helpful—it's essential. Without this information, you're making decisions in the dark.
This guide shows exactly how to track scroll depth, what the data means, and what to do about it.
Key Takeaways
- Scroll depth tracking reveals how far visitors actually scroll before leaving your page, showing whether they reach your offers
- Google Analytics and specialized tools can measure scroll behavior through event tracking and heatmaps without requiring technical expertise
- Most websites lose 50% of visitors before they scroll halfway down the page, making placement critical for conversion
- Simple changes based on scroll data can dramatically improve whether people see and act on your offers
- Regular monitoring helps you optimize continuously rather than guessing where to place important content
Why Scroll Depth Matters for Your Business
People don't read websites the way you think they do.
They scan. They skim. They leave.
If your offer sits below where most people stop scrolling, it might as well not exist. You're losing potential customers not because your offer isn't good, but because they never saw it.
Scroll depth tells you the truth about visitor behavior. It shows where people stop paying attention. It reveals the invisible line between what gets seen and what gets ignored.
This matters because placement drives results.
An offer placed where 80% of visitors see it will always outperform the same offer placed where only 20% scroll. The offer hasn't changed. The visibility has.
Understanding scroll behavior is understanding your conversion potential.
How Do I Check If People Scroll Down Far Enough to See My Offers Using Analytics?
The most straightforward way to track scroll depth is through your existing analytics setup.
Google Analytics can measure how far people scroll on any page. You just need to configure it properly.
Setting Up Scroll Tracking in Google Analytics 4
GA4 includes scroll tracking as a built-in feature, but it needs to be enabled.
Here's how it works:
Navigate to your GA4 property. Go to Admin, then Data Streams, and select your website stream.
Enable enhanced measurement. Click the gear icon next to "Enhanced measurement" and make sure "Scrolls" is toggled on.
That's it for basic setup.
GA4 will now automatically track when someone scrolls to 90% of your page depth. This gives you a baseline understanding of engagement.
But here's the limitation: 90% is arbitrary. Your offer might sit at 60% down the page. Or 40%. The default setting won't tell you if people reach your specific content.
Creating Custom Scroll Depth Events
For more precise tracking, set up custom events that fire at specific scroll percentages.
This requires adding some code to your website, but it's simpler than it sounds.
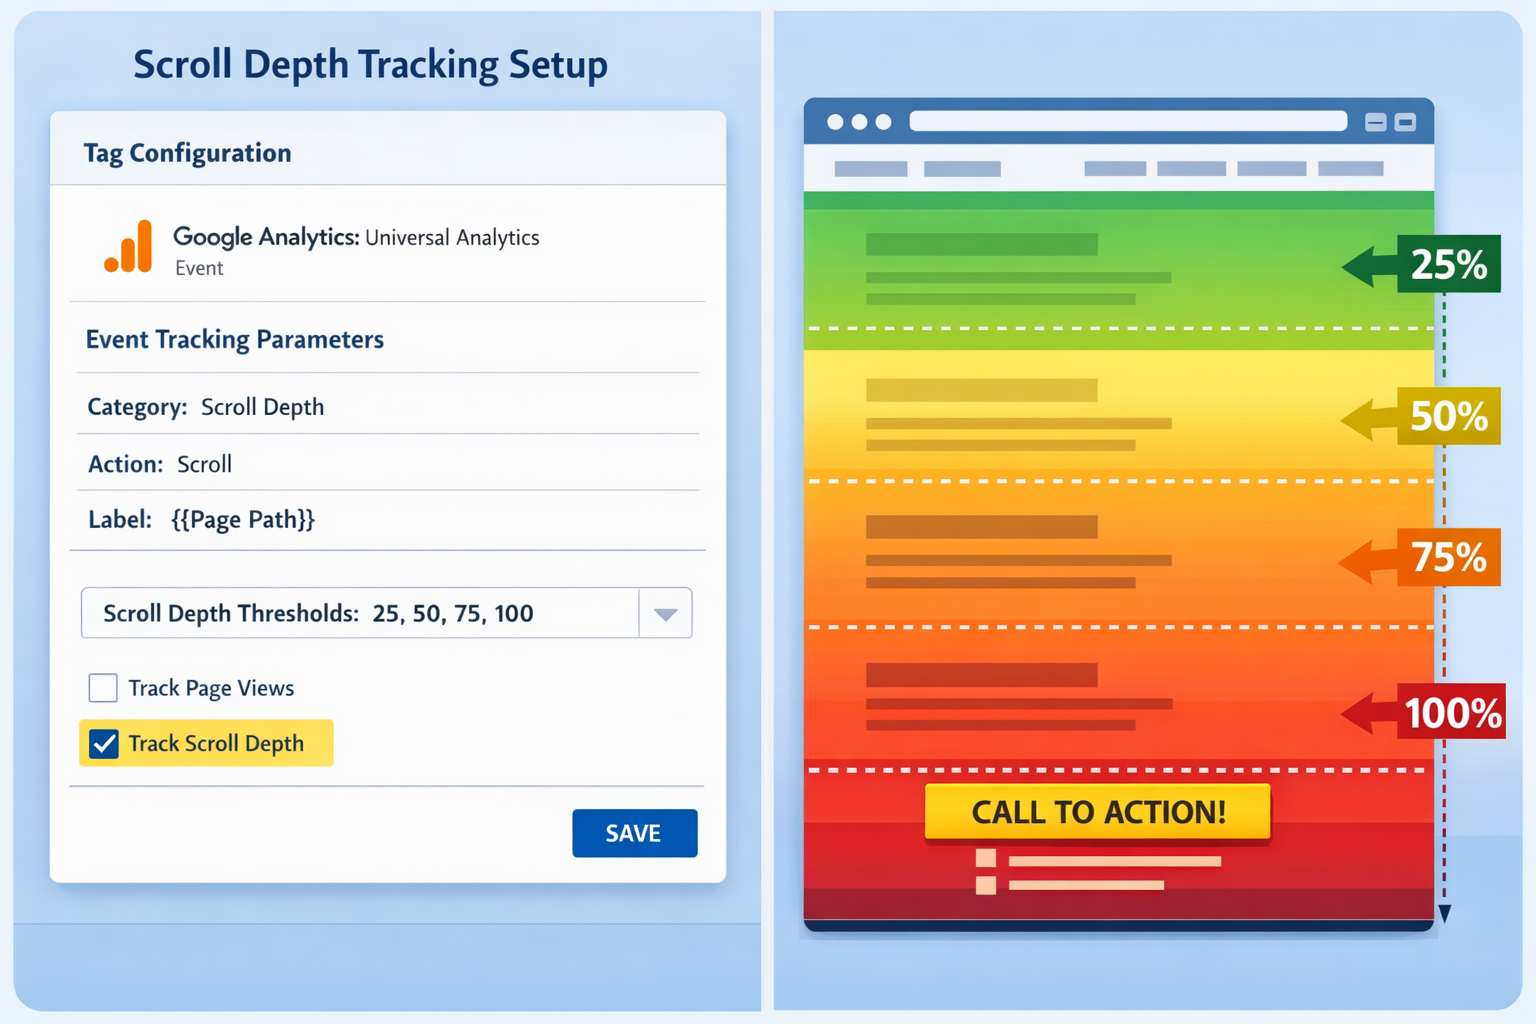
You can use Google Tag Manager to create triggers that fire when someone scrolls to 25%, 50%, 75%, and 100% of your page. Each trigger sends an event to GA4.
Once configured, you'll see exactly what percentage of visitors reach each depth marker.
If your offer appears at 60% down the page, and only 30% of visitors scroll that far, you've found your problem.
The dashboard approach makes tracking these metrics straightforward once you've set everything up properly.
Understanding What the Scroll Data Actually Tells You
Numbers without context are just numbers.
Seeing that 40% of visitors scroll to 75% depth is interesting. But what does it mean for your business?
Interpreting Scroll Percentages
Start by mapping your content to scroll percentages.
Open your page and scroll down slowly. Note where key elements appear:
- Your main value proposition
- Your first call-to-action
- Your detailed offer
- Testimonials or social proof
- Your final conversion opportunity
Now compare these positions to your scroll depth data.
If 60% of people stop at 50% scroll depth, and your offer appears at 70% depth, you have a visibility problem.
The math is simple but powerful.
Benchmark Against Page Type
Different page types have different scroll patterns.
Homepage visitors typically scroll less than blog readers. Product pages see different behavior than about pages.
Here are rough benchmarks:
- Homepage: 50-60% scroll to 50% depth
- Blog posts: 70-80% scroll to 50% depth
- Landing pages: 40-50% scroll to 50% depth
- Product pages: 60-70% scroll to 50% depth
These aren't rules. They're starting points for comparison.
If your product page performs significantly below these ranges, investigate why. Long load times, poor mobile experience, or unengaging content might be pushing people away before they scroll.
How Do I Check If People Scroll Down Far Enough Using Heatmaps?
Analytics tells you how far people scroll. Heatmaps show you where they pay attention.
This distinction matters.
Someone might scroll to 80% depth but only look at images. They scrolled past your offer without actually seeing it.
Heatmap Tools That Track Scroll Behavior
Several tools provide visual scroll maps:
Hotjar creates scroll heatmaps that show exactly where people stop. The visualization uses color coding—red for high attention, blue for low attention.
Microsoft Clarity offers free scroll tracking with heatmaps. It's surprisingly powerful for a free tool.
Crazy Egg provides scroll maps alongside click tracking and other behavior data.
Each tool works similarly. You add a tracking code to your site, wait for data to accumulate, then review the visual reports.
The advantage over pure analytics? You see the actual page layout overlaid with behavior data.
Reading Scroll Heatmaps Effectively
A scroll heatmap typically shows a gradient of colors down your page.
Red and orange indicate where most people spend time. Yellow shows moderate attention. Green and blue reveal where people rarely scroll.
Look for the "fold line"—the point where color shifts dramatically from warm to cool. This represents where most visitors stop engaging.
If your offer sits in the blue zone, most people never see it.
The solution isn't always moving the offer higher. Sometimes the content above it isn't engaging enough to encourage scrolling.
Heatmaps reveal both problems: placement and engagement.
Practical Steps to Check Scroll Depth Right Now
Stop reading and do this:
Step 1: Enable scroll tracking in Google Analytics 4 if you haven't already. This takes five minutes.
Step 2: Sign up for a free heatmap tool like Microsoft Clarity. Add the tracking code to your site.
Step 3: Wait 7-14 days for meaningful data to accumulate. You need enough visitors to see patterns.
Step 4: Review the data with your specific offers in mind. Don't just look at percentages—map them to actual content.
Step 5: Document what you find. Create a simple spreadsheet: Page URL, Offer Location, Scroll Percentage Reached, Percentage of Visitors Who See It.
This process gives you concrete answers to the question: how do I check if people scroll down far enough to see my offers?
The answer is always in the data, not in assumptions.
What to Do When People Don't Scroll Far Enough
Discovering the problem is step one. Fixing it is step two.
If your scroll data reveals that people aren't reaching your offers, you have several options.
Move Critical Offers Higher
The simplest solution is often the right one.
If only 30% of visitors scroll far enough to see your main offer, move it higher on the page.
This doesn't mean cramming everything above the fold. It means being strategic about placement.
Put your most important conversion opportunity where most people will see it. Secondary offers can sit lower for the engaged minority who keep scrolling.
Improve Content Above the Offer
Sometimes the problem isn't where the offer sits—it's that nothing above it encourages scrolling.
Boring content, long paragraphs, or lack of visual interest all reduce scroll depth.
Break up text with images, subheadings, and white space. Create curiosity that pulls people down the page. Use visual cues like arrows or partial content that hints at more below.
The content above your offer should create momentum toward it.
Add Multiple Conversion Points
Don't rely on a single offer placement.
If you have something important to promote, mention it multiple times at different scroll depths.
A brief version at 25% depth for skimmers. A detailed version at 60% depth for engaged readers. A final reminder at 90% depth for thorough readers.
This strategy ensures you capture attention regardless of how far someone scrolls.
Test Mobile Separately
Mobile users scroll differently than desktop users.
They often scroll further because mobile pages are longer by nature. But they also have smaller screens, which changes what's visible at any given moment.
Check your scroll depth data separately for mobile and desktop. Your offer might be perfectly placed for desktop but buried on mobile.
Most analytics tools let you segment by device type. Use this feature.
Advanced Scroll Tracking Techniques
Once you've mastered basic scroll tracking, consider these advanced approaches.
Element-Specific Visibility Tracking
Instead of tracking scroll percentage, track when specific elements become visible.
This is more precise. It tells you exactly when your offer enters the viewport, regardless of page length or screen size.
Google Tag Manager can set this up using visibility triggers. You tag your offer element, then create a trigger that fires when it's 50% visible on screen.
This approach eliminates guesswork about percentages and focuses on actual visibility.
Scroll Engagement Scoring
Not all scrolling indicates engagement.
Someone might scroll quickly to the bottom looking for contact information, passing your offer without reading anything.
Advanced tracking measures scroll speed and pauses. Slow scrolling with frequent stops suggests reading. Fast scrolling suggests scanning or searching.
Tools like Heap and Mixpanel offer this level of behavioral analysis.
For most small businesses, this is overkill. But if you're optimizing high-value pages, it provides deeper insight.
Correlation with Conversions
The ultimate question isn't just "did they scroll?" but "did scrolling lead to conversion?"
Track the correlation between scroll depth and conversion actions.
Create segments in your analytics:
- Visitors who scrolled to 75%+ and converted
- Visitors who scrolled to 75%+ but didn't convert
- Visitors who scrolled less than 75% and converted
- Visitors who scrolled less than 75% and didn't convert
This reveals whether scroll depth actually predicts conversion for your specific site.
You might discover that conversions happen regardless of scroll depth, suggesting your offer placement isn't the limiting factor. Or you might find that scroll depth strongly correlates with conversion, confirming that visibility drives results.
Getting started with proper tracking is easier when you sign up for tools that simplify the technical setup.
Common Mistakes When Checking Scroll Depth
Avoid these pitfalls:
Mistake 1: Not waiting for enough data. One week with 50 visitors won't tell you anything reliable. Wait for at least 500-1000 page views before drawing conclusions.
Mistake 2: Ignoring device differences. Desktop and mobile behavior varies dramatically. Always segment your data.
Mistake 3: Focusing only on averages. The median scroll depth is often more meaningful than the average. A few people scrolling to 100% can skew the average upward.
Mistake 4: Not considering page length. A 2000-word blog post and a 500-word landing page will have completely different scroll patterns. Context matters.
Mistake 5: Forgetting about page speed. If your page loads slowly, people leave before scrolling. Check load times before assuming scroll depth is the only issue.
Mistake 6: Making changes without testing. Moving an offer higher might seem logical, but test it. Sometimes the context provided by surrounding content matters more than position.
Tools and Resources for Scroll Tracking
Here's a practical toolkit:
Free Options
- Google Analytics 4: Built-in scroll tracking at 90% depth
- Microsoft Clarity: Free heatmaps and scroll maps
- Google Tag Manager: Free tool for setting up custom scroll triggers
Paid Options
- Hotjar: Starting around $39/month, excellent scroll and click heatmaps
- Crazy Egg: Similar pricing, includes A/B testing features
- Lucky Orange: Real-time visitor tracking with scroll maps
Technical Resources
- Google Tag Manager templates for scroll depth tracking (available in the GTM template gallery)
- Analytics plugins for WordPress that include scroll tracking (MonsterInsights, ExactMetrics)
The right tool depends on your technical comfort level and budget.
Start with free options. Upgrade only when you've proven the value of the data and need more sophisticated features.
For comprehensive tracking across your entire site, explore the tools available through the main Opal44 platform.
Creating an Ongoing Scroll Monitoring System
Checking scroll depth once isn't enough.
User behavior changes. Your content changes. New devices and browsers emerge.
Build a system for ongoing monitoring:
Monthly Review: Check scroll depth data for your top 10 most important pages. Look for significant changes from the previous month.
Quarterly Deep Dive: Analyze scroll behavior across your entire site. Identify patterns and outliers.
Post-Change Verification: Whenever you redesign a page or move content, check scroll depth within two weeks to verify the impact.
Seasonal Comparison: Compare scroll behavior year-over-year to account for seasonal traffic variations.
This systematic approach prevents you from making decisions based on outdated assumptions.
Real-World Application: A Simple Case Study
Here's how this works in practice:
A consulting business had a detailed service package offer positioned 70% down their homepage. Conversion rate was disappointing at 1.2%.
They checked scroll depth and discovered only 25% of visitors scrolled past 60%.
The offer was invisible to 75% of traffic.
They made two changes:
First, they added a brief version of the offer at 40% depth with a "learn more" link to the detailed version below.
Second, they improved the content between 20-40% depth to encourage scrolling, adding client logos and a compelling subheading.
Within three weeks, scroll depth to 60% increased to 38%. Conversion rate jumped to 2.1%.
Same offer. Same traffic sources. Different visibility.
The improvement came from answering one question: how do I check if people scroll down far enough to see my offers?
Then acting on the answer.
Conclusion: Stop Guessing, Start Measuring
You can't fix what you don't measure.
Scroll depth tracking removes the guesswork from content placement. It shows exactly where people stop paying attention and reveals whether your offers are being seen.
The process is straightforward:
Enable scroll tracking in your analytics. Add a heatmap tool. Wait for data. Review the results. Make informed changes.
Most business owners never do this. They place offers based on intuition, then wonder why conversions disappoint.
You now know better.
Start today. Enable scroll tracking right now. It takes minutes and costs nothing.
Check back in two weeks. Review the data. Map it to your actual offers.
Then make one change based on what you learned.
That single change, informed by real behavior data, will likely improve your results more than a dozen changes based on guesswork.
The question "how do I check if people scroll down far enough to see my offers?" now has a clear answer.
The only question left is whether you'll act on it.
For additional support and resources on tracking website performance, visit our contact page or explore our partners who specialize in analytics implementation.
Other frequently asked questions
- How Do I Check Which Pages People Spend the Most Time On
- How Do I Track Sales From My Google Ads Campaigns
- Will AI Take Over Data Analytics
- How Do I Track Phone Calls or Email Clicks as Conversions
- How Do I Track How Many People Fill Out My Contact Form
- How Do I Track How Many People Watch a Video or Download a Brochure
- How Do I Know Which Pages Lead to the Most Conversions
- How Do I See Where Most People Drop Off During Checkout
- How Do I See Where My Website Visitors Are Coming From
- How Do I See Which Blog Posts Bring Me the Most Visitors
- How Do I Check if My Homepage Is Actually Performing Well
- How Do I Find Out How Long It Takes Someone to Become a Customer
- How Do I Find Out What Paths People Take Before They Buy or Sign Up
- How Do I Measure Which Traffic Source Brings the Most Paying Customers
- How Do I See if Discounts or Offers Increase Sales
- How to See What Visitors Do First When They Land on Your Site