How Do I Check If My Homepage Is Actually Performing Well?
Your homepage gets traffic. But is it actually working?
Most business owners check their visitor numbers and call it a day. But traffic alone tells you almost nothing about performance. A homepage could get thousands of visits and still be failing at its job.
The real question isn't how many people visit. It's what they do when they get there.
Understanding how to check if your homepage is actually performing well means looking at the right metrics, in the right way, and knowing what the numbers actually mean for your business.
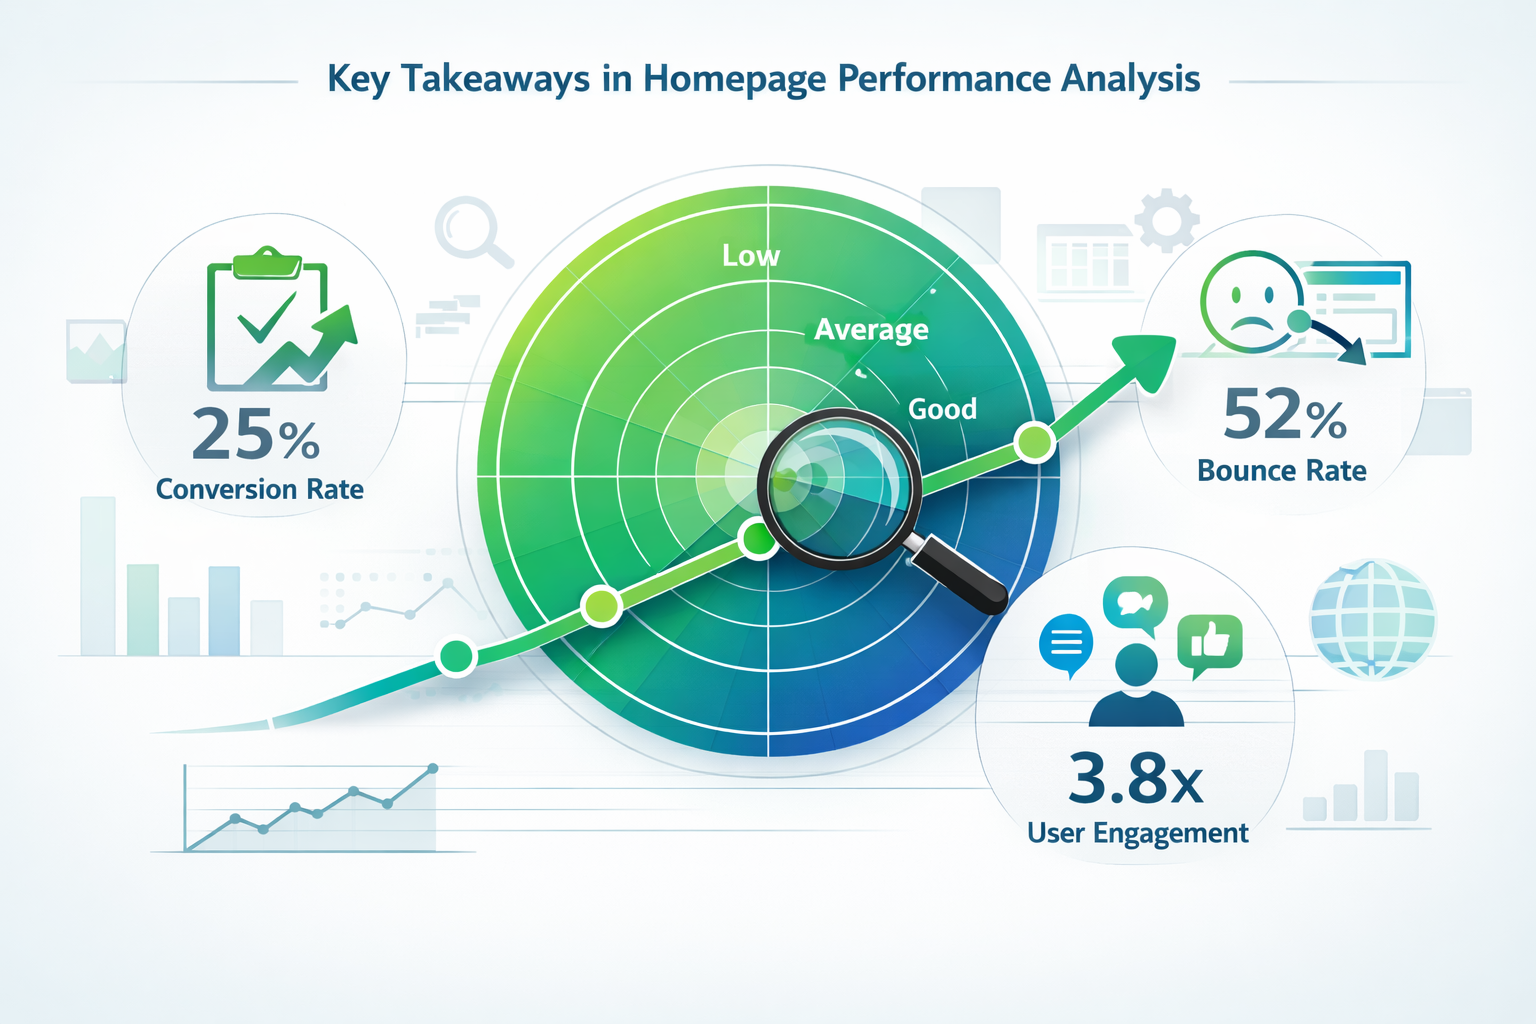
Key Takeaways
- Homepage performance isn't about traffic volume—it's about what visitors do after they arrive
- Bounce rate, session duration, and conversion tracking reveal whether your homepage guides visitors toward meaningful actions
- Page speed and mobile performance directly impact whether visitors stay long enough to engage
- Regular monitoring with simple tools helps you catch problems before they cost you customers
- Small improvements based on real data often deliver better results than complete redesigns
Why Most People Check the Wrong Things

When you open your analytics, the big number at the top catches your eye.
Total visitors. Sessions. Page views.
These numbers feel important. They go up, and you feel good. They go down, and you worry.
But here's the problem: these metrics don't tell you if your homepage is doing its job.
A homepage exists to guide visitors somewhere useful. To help them understand what you do. To move them toward a purchase, a signup, or a call.
Traffic without action is just noise.
You need to look deeper. And that starts with understanding what "performing well" actually means for your specific business.
What "Performing Well" Actually Means
Performance isn't universal.
A homepage for an e-commerce store has different goals than one for a consulting firm. A SaaS company measures success differently than a local service business.
Before you check any metrics, answer this question: What should visitors do on my homepage?
Common homepage goals include:
- Click through to product or service pages
- Sign up for a newsletter or trial
- Make a purchase directly
- Book a consultation or call
- Download a resource
- Contact the business
Your homepage performs well when visitors complete these actions at a healthy rate.
Everything else is just setup.
How Do I Check If My Homepage Is Actually Performing Well? The Essential Metrics
Let's get practical. Here are the metrics that actually matter.
Bounce Rate
Bounce rate shows the percentage of visitors who land on your homepage and leave without clicking anything.
A high bounce rate (above 70%) usually signals a problem. Either visitors don't understand what you offer, or they don't see a reason to stay.
But context matters.
If your homepage clearly displays your phone number and people call you directly, they might bounce—but they're still converting. The metric alone doesn't tell the whole story.
Check your bounce rate in Google Analytics. Navigate to Behavior > Site Content > All Pages and find your homepage URL.
Average Session Duration
This tells you how long people spend on your homepage before leaving or clicking elsewhere.
If the average is under 30 seconds, most visitors aren't reading your content. They're scanning and leaving.
If it's over two minutes, people are engaging—but maybe not finding what they need quickly enough.
The sweet spot depends on your content, but 45 seconds to 90 seconds often indicates healthy engagement for a typical business homepage.
Scroll Depth
Most homepages are longer than one screen. Scroll depth shows how far down the page visitors actually go.
If 80% of visitors never scroll past the first section, everything below that fold is invisible. You're wasting valuable real estate.
Google Analytics doesn't track this by default, but you can set up scroll tracking through Google Tag Manager or use tools like Hotjar or Microsoft Clarity.
If people aren't scrolling, your most important content needs to move up.
Conversion Rate
This is the big one.
Your conversion rate shows the percentage of homepage visitors who complete your desired action.
To track this properly, you need conversion goals set up in your analytics. If you haven't done this yet, start with the dashboard to get your tracking configured correctly.
A good homepage conversion rate varies wildly by industry and goal type:
- E-commerce product clicks: 2-5%
- Newsletter signups: 1-3%
- Contact form submissions: 0.5-2%
- Free trial signups: 1-5%
Compare your numbers to industry benchmarks, but focus more on your own trends over time.
Click-Through Rate on Key Elements
Which buttons and links are people actually clicking?
Your analytics should show you the most-clicked elements on your homepage. If your main call-to-action button gets fewer clicks than your privacy policy link, something's wrong.
Heatmap tools make this visual and obvious. They show exactly where people click, move their mouse, and focus their attention.
The data often surprises you. What you think is prominent might be completely ignored.
Page Load Speed
Speed isn't just a technical metric. It's a performance killer.
If your homepage takes more than three seconds to load, you're losing visitors before they even see your content.
Check your speed using:
- Google PageSpeed Insights
- GTmetrix
- WebPageTest
These tools give you a score and specific recommendations for improvement.
Every second of delay costs you conversions. This isn't theory—it's proven across millions of websites.
Mobile vs. Desktop Performance
In 2026, most traffic comes from mobile devices.
If your homepage performs well on desktop but poorly on mobile, you're missing the majority of your audience.
Check your analytics broken down by device type. Look at:
- Bounce rate differences
- Conversion rate differences
- Session duration differences
If mobile metrics are significantly worse, your homepage isn't responsive enough or loads too slowly on phones.
How to Actually Check These Metrics (Step by Step)
Here's the practical process for checking if your homepage is actually performing well.
Step 1: Set Up Google Analytics Properly
If you haven't already, install Google Analytics 4 on your website.
Make sure your homepage is being tracked. Check that page views are registering correctly.
This is foundational. Without proper tracking, you're flying blind.
Step 2: Define Your Conversion Goals
In Google Analytics, set up events for the actions that matter:
- Button clicks
- Form submissions
- Phone number clicks
- Email link clicks
- Scroll milestones
Each of these becomes trackable data you can analyze.
If you need help with setup, contact support to ensure your tracking is configured correctly.
Step 3: Create a Homepage Performance Dashboard
Don't dig through reports every time you want to check performance.
Create a simple dashboard that shows:
- Homepage traffic (last 30 days)
- Bounce rate
- Average session duration
- Conversion rate
- Top exit pages
- Mobile vs. desktop breakdown
Review this dashboard weekly or monthly, depending on your traffic volume.
Step 4: Add Heatmap Tracking
Install a heatmap tool like Hotjar, Microsoft Clarity, or Crazy Egg.
Let it collect data for at least a week (longer if you have low traffic).
Then review:
- Click maps: Where people actually click
- Scroll maps: How far people scroll
- Movement maps: Where attention focuses
This visual data reveals problems that numbers alone miss.
Step 5: Run Speed Tests
Use Google PageSpeed Insights to test both mobile and desktop performance.
Focus on the "Core Web Vitals" section. These metrics directly impact search rankings and user experience.
If your scores are below 70, prioritize speed improvements.
Step 6: Compare Against Benchmarks
Look at your metrics compared to:
- Your own historical performance
- Industry averages
- Your specific goals
Improvement over time matters more than hitting arbitrary numbers.
If your bounce rate drops from 75% to 60% over three months, you're moving in the right direction—even if 60% isn't "perfect."
Common Warning Signs Your Homepage Isn't Performing
Watch for these red flags:
? Bounce rate above 70% (for most business types)
? Average session duration under 30 seconds
? Less than 50% of visitors scroll past the first screen
? Conversion rate below 1% (for most goal types)
? Page load time over 3 seconds
? Mobile bounce rate significantly higher than desktop
? High traffic but few conversions
Any of these signals a problem worth investigating.
What to Do When Performance Is Poor
Finding problems is only useful if you fix them.
If Bounce Rate Is High
- Clarify your headline. Make it obvious what you do and who you help.
- Improve visual hierarchy. Guide the eye to important elements.
- Speed up load time. Slow pages drive people away immediately.
- Match visitor intent. If people arrive from ads or search, deliver what they expect.
If Session Duration Is Low
- Make content scannable. Use short paragraphs, bullet points, and clear headings.
- Add engaging visuals. Break up text with relevant images or videos.
- Create clear next steps. Tell visitors exactly what to do next.
If Conversions Are Low
- Simplify your call-to-action. One clear primary action works better than five competing options.
- Reduce friction. Shorter forms, fewer required fields, clearer value propositions.
- Test different offers. Sometimes the problem isn't the homepage—it's what you're asking for.
- Build trust signals. Add testimonials, logos, guarantees, or credentials.
If Mobile Performance Lags
- Test on real devices. What looks fine on your desktop might be broken on phones.
- Optimize images for mobile. Large images kill mobile load times.
- Simplify mobile navigation. Touch targets need to be bigger and clearer.
- Prioritize above-the-fold content. Mobile screens are small—make the first screen count.
How Often Should You Check Homepage Performance?

This depends on your traffic volume.
High traffic (1,000+ visitors per week): Check weekly. You'll have enough data to spot trends quickly.
Medium traffic (100-1,000 visitors per week): Check every two weeks or monthly. Weekly checks might show too much noise.
Low traffic (under 100 visitors per week): Check monthly or quarterly. Smaller sample sizes need more time to reveal meaningful patterns.
Set a recurring calendar reminder. Make performance review a habit, not something you remember randomly.
Between regular reviews, set up alerts for major changes. If your bounce rate suddenly spikes or conversions drop dramatically, you want to know immediately.
Tools That Make Checking Performance Easier
You don't need expensive enterprise software. These tools cover most needs:
Free Tools:
- Google Analytics 4 (essential foundation)
- Google Search Console (shows search performance)
- Google PageSpeed Insights (speed testing)
- Microsoft Clarity (free heatmaps and session recordings)
Paid Tools (Worth Considering):
- Hotjar (heatmaps, recordings, feedback)
- Crazy Egg (heatmaps and A/B testing)
- Semrush or Ahrefs (competitive analysis)
Start with the free tools. Add paid options when you need deeper insights.
If you're looking for a simpler way to monitor everything in one place, explore the dashboard options designed specifically for business owners who want clarity without complexity.
Beyond the Numbers: Qualitative Checks
Data tells you what's happening. It doesn't always tell you why.
Supplement your metrics with qualitative research:
User Testing
Ask real people (not your team) to use your homepage while you watch.
What confuses them? Where do they hesitate? What do they expect that isn't there?
Five user tests reveal more usability problems than five hundred analytics reports.
Customer Feedback
Talk to actual customers. Ask how they found you and what made them choose you.
Their answers often highlight homepage elements that matter most—or reveal that your homepage barely factored into their decision.
Competitor Comparison
Look at homepages from successful competitors.
What are they doing differently? What seems to work well? What could you adapt (not copy) for your own site?
This isn't about imitation. It's about understanding what your audience expects in your industry.
The Biggest Mistake When Checking Homepage Performance
Here's what trips people up: checking metrics without taking action.
You review your analytics. You see problems. You close the tab and move on.
Data without decisions is just distraction.
When you check your homepage performance, end each review session with one clear action:
- "I'll move the call-to-action button higher on the page."
- "I'll simplify the headline to be more specific."
- "I'll compress images to improve load speed."
- "I'll add customer testimonials above the fold."
Small improvements compound over time. One monthly change leads to meaningful performance gains over a year.
Making Performance Monitoring a System
The best approach isn't checking your homepage once and forgetting about it.
Build a simple system:
- Monthly performance review (30 minutes)
- Identify one improvement based on data
- Implement the change
- Track results over the next 30 days
- Repeat
This creates a continuous improvement cycle. Your homepage gets better month after month, driven by real performance data instead of guesses.
Document what you change and when. If performance improves or declines, you'll know what caused it.
For businesses working with partners or agencies, this documentation makes collaboration clearer and more effective.
Conclusion: Performance Is a Process, Not a One-Time Check
Checking if your homepage is actually performing well isn't a single task you complete and cross off your list.
It's an ongoing process of measuring, understanding, and improving.
The metrics matter. Bounce rate, session duration, conversions, speed—these numbers reveal whether your homepage serves your business or wastes opportunities.
But the metrics are only useful when they drive action.
Start simple. Pick three metrics to track this month. Review them weekly. Make one small improvement based on what you find.
Next month, add another metric. Make another improvement.
Over time, this approach transforms an underperforming homepage into a reliable business asset that consistently guides visitors toward meaningful action.
Your homepage is often the first impression of your business. Make sure it's performing like it matters—because it does.
Ready to start monitoring your homepage performance with clarity and confidence? Sign up to access tools designed specifically for business owners who want results without complexity.
SEO Meta Title and Description
Meta Title: How to Check If Your Homepage Is Performing Well (2026)
Meta Description: Learn how to check if your homepage is actually performing well using key metrics like bounce rate, conversions, and speed. Practical guide for business owners.
Other frequently asked questions
- How Do I Check Which Pages People Spend the Most Time On
- How Do I Track Sales From My Google Ads Campaigns
- Will AI Take Over Data Analytics
- How Do I Track Phone Calls or Email Clicks as Conversions
- How Do I Track How Many People Fill Out My Contact Form
- How Do I Track How Many People Watch a Video or Download a Brochure
- How Do I Know Which Pages Lead to the Most Conversions
- How Do I See Where Most People Drop Off During Checkout
- How Do I See Where My Website Visitors Are Coming From
- How Do I See Which Blog Posts Bring Me the Most Visitors
- How Do I Check if My Homepage Is Actually Performing Well
- How Do I Find Out How Long It Takes Someone to Become a Customer
- How Do I Find Out What Paths People Take Before They Buy or Sign Up
- How Do I Measure Which Traffic Source Brings the Most Paying Customers
- How Do I See if Discounts or Offers Increase Sales
- How to See What Visitors Do First When They Land on Your Site