How Do I Check If My Facebook or Instagram Ads Are Working?
You've launched your Facebook or Instagram ads. Money is leaving your account. But here's the question keeping you up at night: are they actually working?
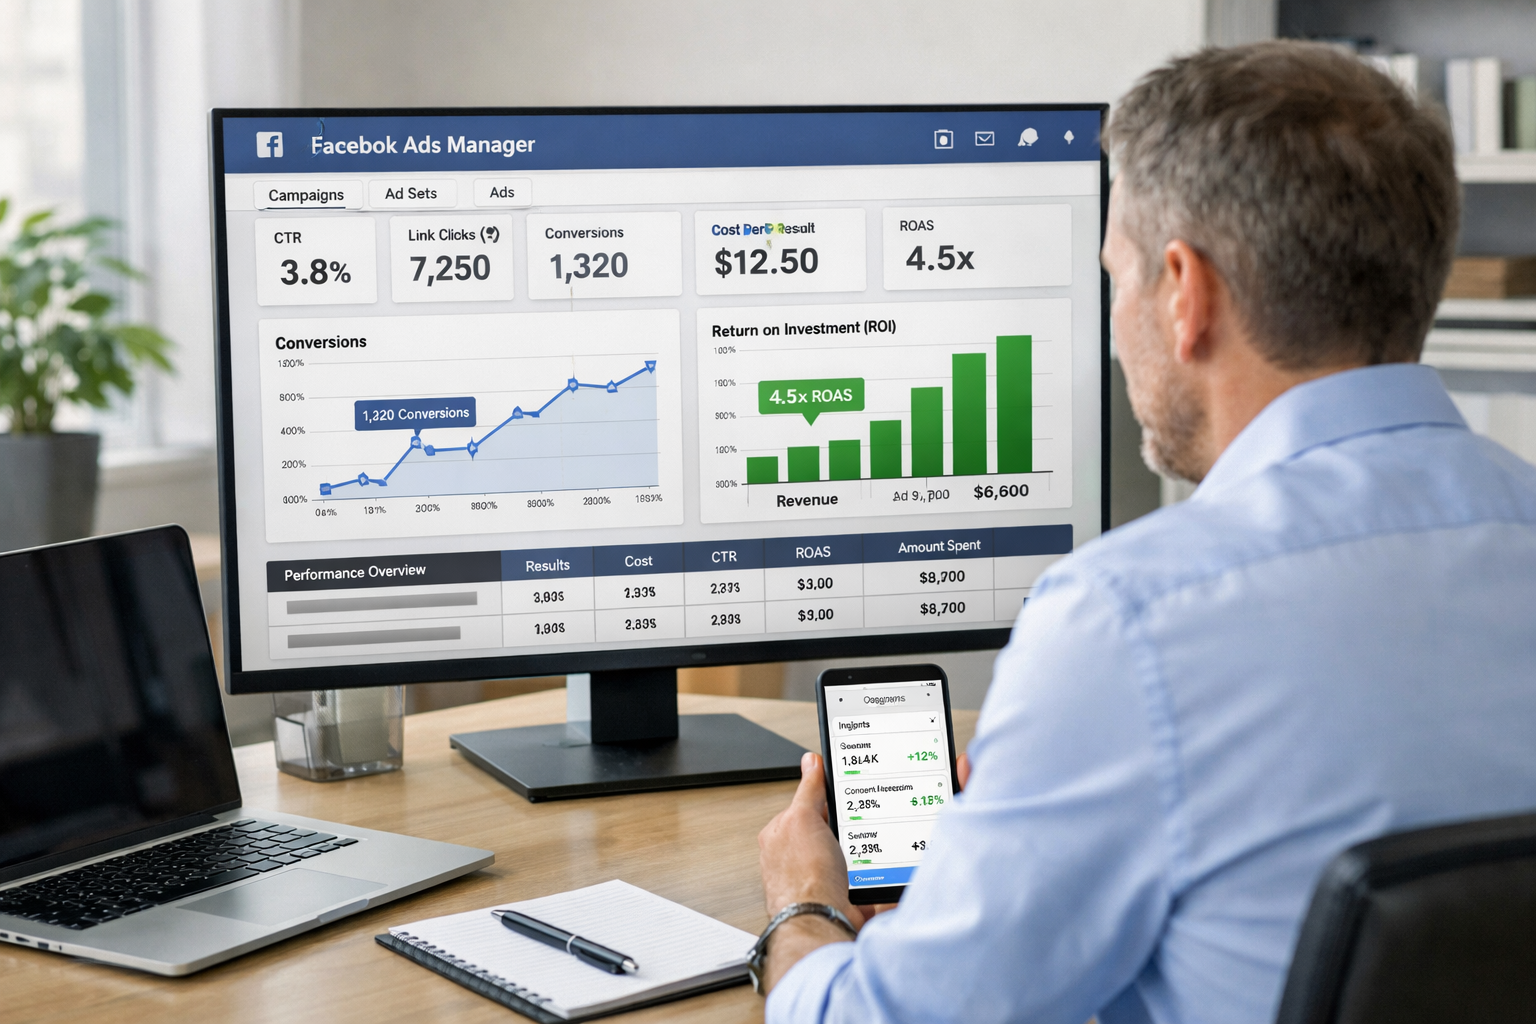
Most business owners stare at their Ads Manager dashboard like it's written in hieroglyphics. Numbers everywhere. Graphs going up and down. But no clear answer to the one question that matters.
This guide will show you exactly how to check if your Facebook or Instagram ads are working, using metrics that actually matter for your business.
Key Takeaways
- Focus on business outcomes first – clicks and likes don't pay the bills; conversions and revenue do
- Check three core metrics – cost per result, return on ad spend (ROAS), and conversion rate tell you if ads are profitable
- Give ads time to work – at least 3-7 days of data before making decisions; Facebook's algorithm needs learning time
- Compare against your baseline – ads should perform better than your organic efforts or previous campaigns
- Track the full customer journey – not just ad clicks, but what happens after people reach your website
Understanding What "Working" Actually Means
Before diving into metrics, define what success looks like for your business.
"Working" means different things to different people.
For one business, working means getting 50 new email subscribers at under $2 each. For another, it means selling $5,000 worth of products with a 3x return on ad spend.
The metrics you check depend entirely on your goal.
If you're building awareness, you'll look at reach and impressions. If you're driving sales, you'll focus on conversions and revenue. If you're collecting leads, cost per lead is your north star.
Write down your specific goal before you check anything else. This clarity makes everything simpler.
How Do I Check If My Facebook or Instagram Ads Are Working: The Essential Metrics
Here's where the rubber meets the road.
Log into your Facebook Ads Manager dashboard and look at these specific numbers.
Cost Per Result
This is your most important starting metric.
Facebook shows you exactly how much each result costs. A "result" is whatever you told Facebook to optimize for—a purchase, a lead, a click, a video view.
If you're paying $15 per lead and your average customer is worth $200, that's probably working. If you're paying $80 per lead for the same customer, that's not.
Compare your cost per result against your business economics. Does the math work?
Return on Ad Spend (ROAS)
ROAS tells you how much revenue you generate for every dollar spent on ads.
The formula is simple: Revenue from ads ÷ Ad spend = ROAS
A ROAS of 3 means you make $3 for every $1 spent. A ROAS of 0.5 means you're losing money.
Most e-commerce businesses need a ROAS of at least 2-3 to be profitable after accounting for product costs and other expenses. Service businesses often need less because their margins are higher.
Check this number weekly. It's the clearest signal of whether your ads are working.
Conversion Rate
This metric shows what percentage of people who click your ad actually complete your desired action.
Low conversion rate? Your ad might be attracting the wrong people, or your landing page isn't doing its job.
High conversion rate but low overall results? You might need more traffic (higher budget or broader audience).
The conversion rate connects your ad performance to your website performance. Both need to work together.
Where to Find These Numbers in Ads Manager
Open Facebook Ads Manager.
Click on the "Campaigns" tab at the top. You'll see a table with all your active campaigns.
Look at the columns. By default, Facebook shows basic metrics like reach, impressions, and amount spent.
Click "Columns: Performance" dropdown (above the table on the right side). Select "Customize Columns."
Add these columns to your view:
- Cost per result
- Purchase ROAS (if tracking purchases)
- Website purchases or leads (depending on your goal)
- Link clicks
- CTR (click-through rate)
Save this as a custom preset. Name it something like "My Performance View."
Now you have the metrics that matter, visible at a glance.
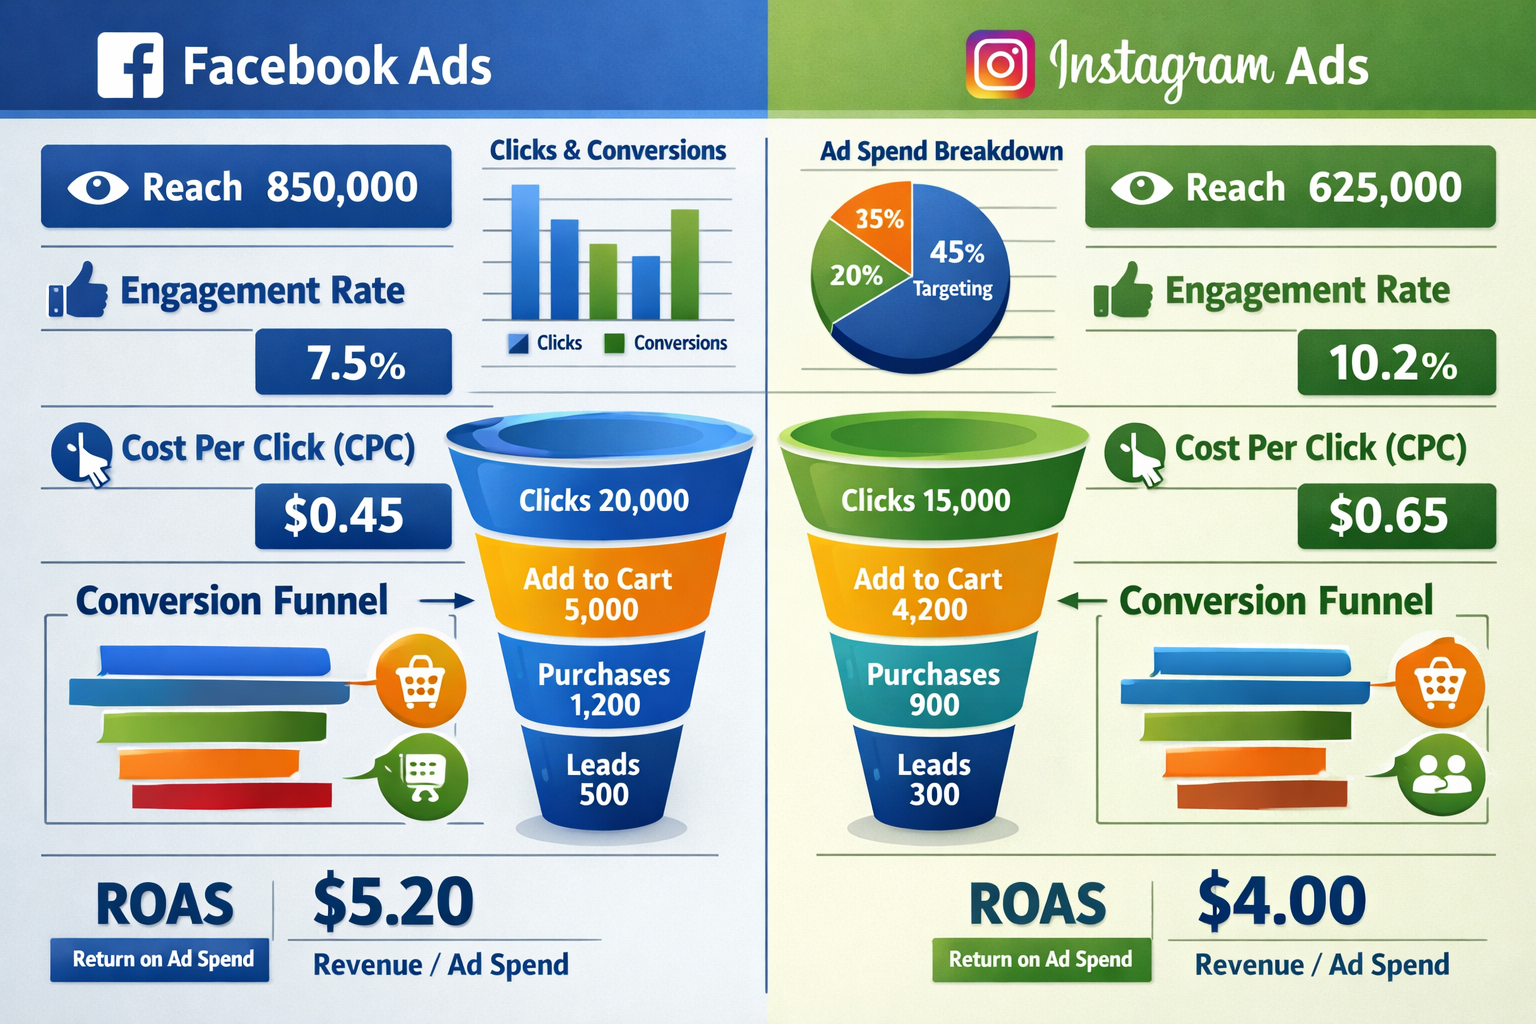
For Instagram-specific performance, use the "Breakdown" dropdown and select "By Placement." This shows you how Instagram performs compared to Facebook.
How to Check If Your Facebook or Instagram Ads Are Working: The 3-Day Rule
Don't panic after day one.
Facebook's algorithm needs time to learn. The platform tests your ad with different people to find who responds best.
This learning phase typically takes 3-7 days or about 50 conversions, whichever comes first.
During this time, your metrics will bounce around. Cost per result might be high one day, low the next. This is normal.
Check your ads daily, but only make decisions based on at least three days of data. Better yet, wait a full week before making major changes.
If you're getting zero results after a week, then you have a problem worth addressing.
Comparing Performance: The Context You Need
Numbers without context are meaningless.
A $5 cost per click might be excellent in one industry and terrible in another.
Here's what to compare your performance against:
Your previous campaigns: Are your current ads performing better or worse than your last campaign? This shows if you're improving.
Industry benchmarks: Facebook doesn't publish official benchmarks, but a quick search for "[your industry] Facebook ad benchmarks 2026" gives you ballpark figures.
Your business math: This is most important. If your customer lifetime value is $500 and you're spending $50 to acquire them, you're winning—regardless of what industry averages say.
Track your own performance over time. That's your real benchmark.
Red Flags That Your Ads Aren't Working
Some warning signs are obvious.
Spending money with zero conversions: If you've spent $200+ with zero leads or sales, something's broken. Either your targeting is off, your offer isn't compelling, or your landing page has issues.
High click-through rate but no conversions: People are interested enough to click, but then they bounce. This usually means a disconnect between your ad promise and your landing page reality.
Decreasing performance over time: Your ads worked great for two weeks, now they're dying. This is ad fatigue—your audience has seen your ad too many times. You need new creative.
Cost per result increasing significantly: If your cost per lead was $10 and now it's $25, your ad is losing effectiveness. Time to refresh or test new audiences.
These red flags demand action. Don't ignore them hoping they'll improve on their own.
Green Flags That Your Ads Are Working
Good performance has clear signals too.
Consistent cost per result: Your cost per lead or sale stays relatively stable day to day. This means Facebook has found your audience and the algorithm is working.
Positive ROAS: You're making more than you're spending. Simple as that.
Steady conversion flow: You're getting regular leads or sales, not random spikes and valleys.
Low frequency: This number (found in Ads Manager) shows how many times the average person has seen your ad. Under 3 is healthy. Over 5 means you're showing the same ad to the same people too often.
When you see these signs, don't mess with success. Let your ads run and scale gradually.
What to Do When Ads Aren't Working
First, identify the specific problem.
Is the issue traffic (not enough people seeing your ad)? Or conversion (people see it but don't act)?
If you're getting impressions but no clicks: Your ad creative or copy isn't compelling. Test new images, videos, or headlines.
If you're getting clicks but no conversions: Your landing page is the problem. Check load speed, clarity of offer, and ease of completing the action.
If your cost per result is too high: Narrow your audience to more qualified prospects, or improve your ad relevance score by better matching ad to audience.
Make one change at a time. Test for at least 3-7 days. Then evaluate.
Changing everything at once makes it impossible to know what worked.
For more strategic guidance, get in touch with experts who can review your specific situation.
Advanced Tracking: Beyond the Ads Manager
Ads Manager shows what happens on Facebook and Instagram.
But what happens after someone clicks through to your website?
This is where many business owners lose the thread.
Install Facebook Pixel on your website. This small piece of code tracks what people do after clicking your ad—whether they browse, add to cart, or purchase.
Without the Pixel, you're flying blind. Facebook can't optimize for conversions it can't see.
Connect your Pixel to your website's conversion events:
- Page views
- Add to cart
- Initiate checkout
- Purchase
- Lead form submission
Once connected, Facebook shows you the complete journey from ad click to final conversion.
This data makes optimization dramatically easier. Facebook can automatically show your ads to people most likely to convert, not just people most likely to click.
If you need help with technical setup, many partners specialize in Facebook Pixel implementation.
The Attribution Window Problem
Here's something that confuses everyone at first.
Someone might see your ad on Monday, think about it, then come back and buy on Friday by typing your website directly into their browser.
Does Facebook get credit for that sale?
It depends on your attribution window—the timeframe Facebook uses to connect actions to ad views or clicks.
The default is 7-day click and 1-day view. This means if someone clicks your ad and converts within 7 days, Facebook counts it. If they just saw your ad (didn't click) and converted within 1 day, Facebook counts it.
You can find this setting in Ads Manager under the attribution dropdown.
Longer attribution windows show more conversions but might overstate Facebook's impact. Shorter windows are more conservative but might miss delayed conversions.
Most businesses do fine with the default settings. Just understand that not every conversion Facebook reports is a same-day decision.
Testing: The Only Way to Improve
You'll never know what works best until you test.
Create two versions of your ad with one difference—different image, different headline, or different audience.
Run both simultaneously with equal budget.
After a week, check which performed better. Keep the winner, test something new against it.
This is called A/B testing, and it's how you systematically improve performance over time.
Test one variable at a time:
- Image vs. video
- Short copy vs. long copy
- One audience vs. another
- Different call-to-action buttons
Small improvements compound. A 10% better conversion rate doesn't sound exciting, but over a year, it means 10% more customers for the same ad spend.
How Often Should You Check Your Ads?
Daily check-ins are fine. Daily panic is not.
Look at your ads each day to make sure they're running and spending isn't out of control.
But make decisions weekly, based on 7 days of data.
Monthly reviews are for bigger picture analysis—which campaigns worked best, what your overall ROAS was, what you learned.
Set a calendar reminder for your weekly review. Block 30 minutes. Check your key metrics, note any trends, decide on one action to take.
This rhythm prevents both neglect and over-tinkering.
When to Scale Winning Ads
You've found an ad that works. Cost per result is good, ROAS is positive, conversions are steady.
Now what?
Scale carefully. Increase budget by 20-30% every few days, not all at once.
Doubling your budget overnight often tanks performance. Facebook's algorithm needs to re-learn with the new budget level.
Gradual increases maintain stability.
You can also scale by duplicating winning ad sets to new audiences, rather than just increasing budget on the existing one.
Watch your metrics closely during scaling. Sometimes what works at $20/day stops working at $100/day because you've exhausted your core audience.
The Bottom Line: How Do I Check If My Facebook or Instagram Ads Are Working?
It comes down to three questions.
Are you getting results? (Leads, sales, whatever you defined as success)
Are those results profitable? (Is your ROAS positive, or your cost per result lower than your customer value?)
Are the results consistent? (Or was it just a lucky day?)
If you can answer yes to all three, your ads are working.
If not, you know exactly what to fix.
The metrics don't lie. They tell you precisely where the breakdown happens—in the ad, in the targeting, or in what happens after the click.
Check your numbers weekly. Make small improvements based on data. Give changes time to work.
That's the entire system.
Conclusion
Checking if your Facebook or Instagram ads are working isn't about staring at vanity metrics like likes and shares.
It's about tracking the numbers that connect directly to your business goals—cost per result, ROAS, and conversion rate.
Log into Ads Manager. Customize your columns to show what matters. Give your ads at least a week to generate meaningful data.
Compare performance against your own business economics, not just industry averages.
When ads work, scale them carefully. When they don't, diagnose the specific problem—traffic or conversion—and fix that one thing.
Most importantly, remember that checking your ads is just the first step. The real value comes from using what you learn to make better decisions.
Start with the metrics covered here. Review them weekly. Test one improvement at a time.
Your ads will tell you exactly what's working if you know which numbers to watch.
Ready to take control of your advertising performance? Sign up to access tools that make tracking and optimization simpler, or visit the homepage to learn more about making your marketing measurable and manageable.
Other frequently asked questions
- How Do I Check Which Pages People Spend the Most Time On
- How Do I Track Sales From My Google Ads Campaigns
- Will AI Take Over Data Analytics
- How Do I Track Phone Calls or Email Clicks as Conversions
- How Do I Track How Many People Fill Out My Contact Form
- How Do I Track How Many People Watch a Video or Download a Brochure
- How Do I Know Which Pages Lead to the Most Conversions
- How Do I See Where Most People Drop Off During Checkout
- How Do I See Where My Website Visitors Are Coming From
- How Do I See Which Blog Posts Bring Me the Most Visitors
- How Do I Check if My Homepage Is Actually Performing Well
- How Do I Find Out How Long It Takes Someone to Become a Customer
- How Do I Find Out What Paths People Take Before They Buy or Sign Up
- How Do I Measure Which Traffic Source Brings the Most Paying Customers
- How Do I See if Discounts or Offers Increase Sales
- How to See What Visitors Do First When They Land on Your Site